In November 2022, .NET 7 and ChatGPT were released with a three-week gap. It became a convenient reference point: .NET 7 was the last release written before ChatGPT. In May 2025, the Copilot coding agent arrived in dotnet/runtime, and by the end of October 2026, it had opened 1734 pull requests, 1207 of which were merged.
Does AI break code? You can argue for a long time, but performance can be simply measured. I measured DI, configuration, logging, cache, and EF Core: 46 operations, six major versions, 30 rounds. At the same time, I checked the Git history to see who touched the hot methods, and traced the two performance dips in 11 RC to specific commits. The largest change was made by a single person. The second, smaller one, came from a PR by the Copilot coding agent, which fixed a deadlock.
How the measurements are structured
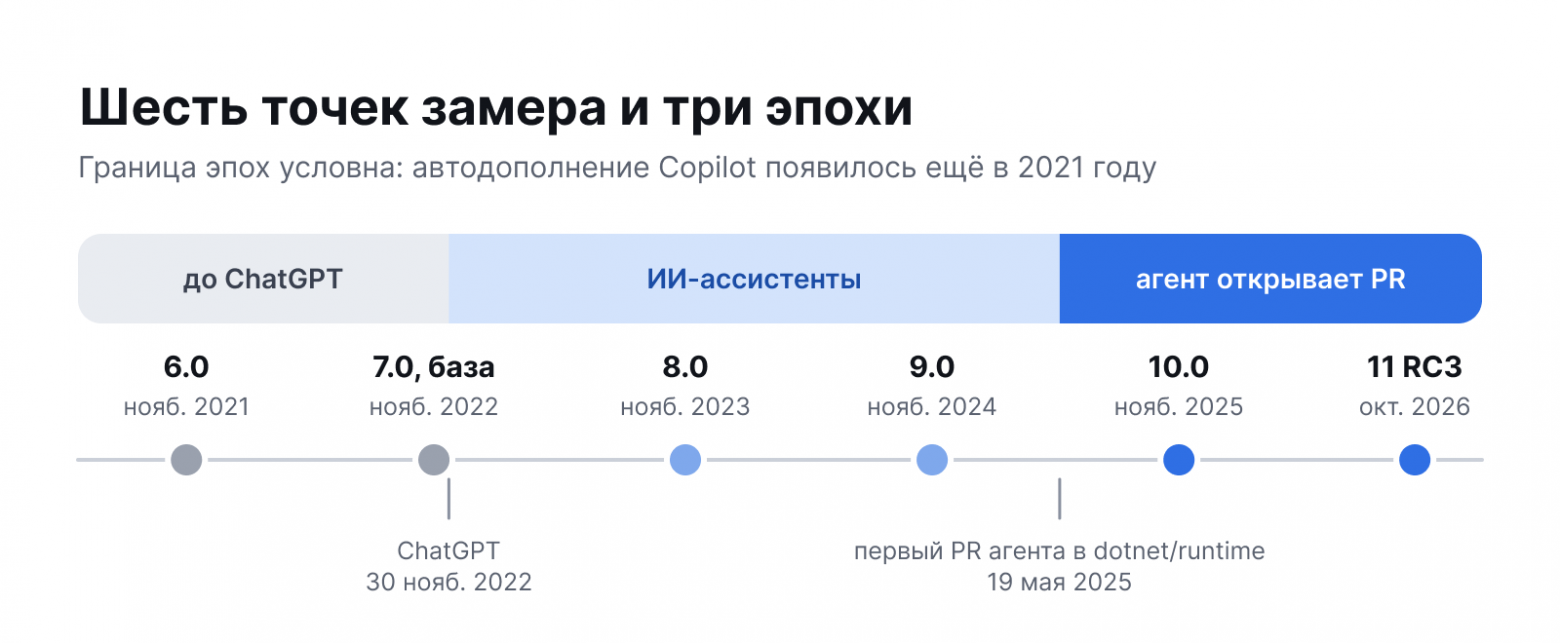
The new .NET is also accelerated by JIT and GC. Therefore, the main track benchmarks the runtime on .NET 10.0.11 and only changes NuGet packages: Microsoft.Extensions.* from version 6 to 11 and EF Core from version 6 to 10 (EF Core 11 requires net11.0, so its lines on the graphs end at 10.0). If another major version is loaded into the process, the test fails. Libraries that are part of the framework itself (System.Text.Json, Channels, ASP.NET Core) cannot be replaced this way: the old package underperforms compared to the built-in assembly. I compare them separately, net10.0 against net11.0, and in that case, you can't separate the library and runtime anymore.
Here's one of the measurements, IOptionsSnapshot in a new scope:
recorder.Measure(OptionsScopes.Snapshot, 1000, () => { for (var i = 0; i < 1000; i++) { using var scope = provider.CreateScope(); Sink.Keep(scope.ServiceProvider.GetRequiredService<IOptionsSnapshot<Poco50>>().Value); });EmberTrace writes the time, and memory is measured by GC.GetAllocatedBytesForCurrentThread. The process undergoes 20 warm-up and 200 measurement iterations, each scenario runs in its own process and is bound to logical cores 2–5. In total, 30 rounds and 111 processes per each version and scenario pair, with the order of versions shuffled in each round.
The unit of observation is the process, all rounds have equal weight. Change is considered within the round relative to 7.0, the confidence interval provides hierarchical bootstrapping, significance is the Mann-Whitney U-test with Benjamini-Hochberg correction. "Faster" or "slower" is assigned only if the entire 95-percent interval lies outside the 5% threshold, no round shows the opposite, and the corrected p is less than 0.05. If the entire interval lies within ±5%, it is considered noise, and everything else remains without a verdict.
The warmed-up code sped up, the first call slowed down
For version 10.0 versus 7.0, the result across 46 operations is as follows: 9 faster, 13 slower, 10 within noise, and 14 no verdict. On the graph, benchmark examples on both sides: repeated operations up to 10.0 accelerated by 14–35%, while first calls and object creation slowed down by 39–64%.
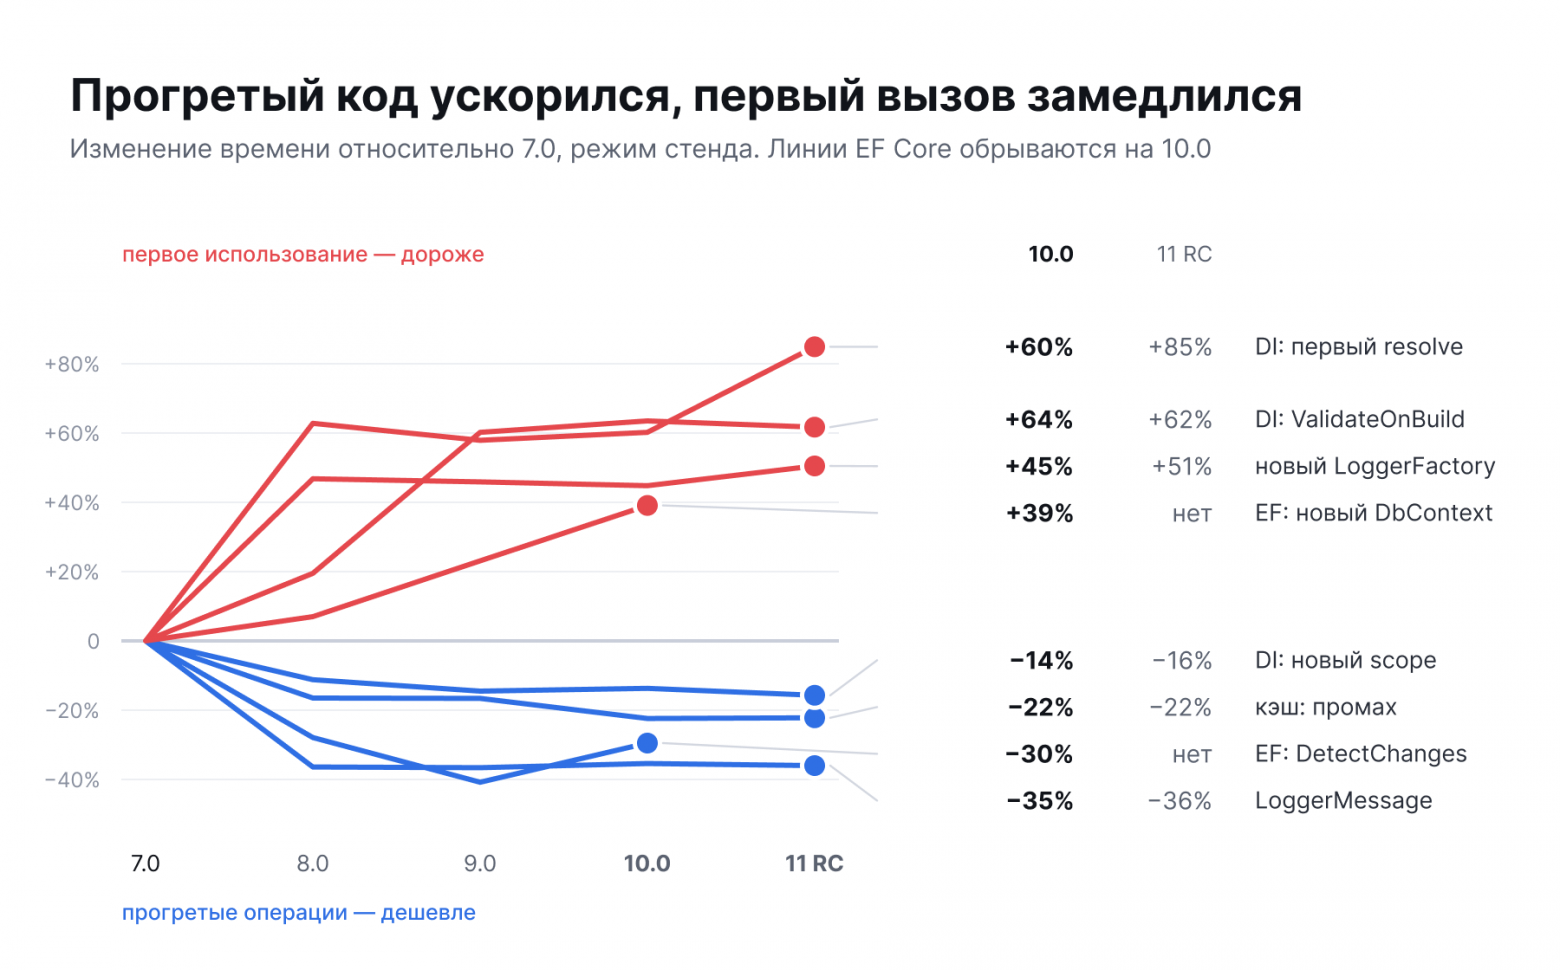
In terms of time units, this looks calmer. Values were measured on a laptop with a 2 GHz frequency, so you should look at the order of magnitude:
Operation | 7.0 | 10.0 |
|---|---|---|
LoggerMessage.Define, one call | 377 ns | 244 ns |
MemoryCache.TryGetValue, hit | 111 ns | 96 ns |
EF DetectChanges, 10 thousand entities | 6,1 ms | 4,3 ms |
DI, first resolve graph with depth 5 | 3,3 µs | 5,2 µs |
Provider assembly with ValidateOnBuild, 100 registrations | 40 µs | 66 µs |
New LoggerFactory | 23 µs | 34 µs |
New DbContext | 37 µs | 51 µs |
EF, the very first query in the process | 996 ms | 1162 ms |
For a long-lived service, this trade-off is beneficial: logging is performed millions of times, and the provider is compiled once. Short-lived processes have less luck, especially with EF: the first query cost increased by 166 ms, which is already a noticeable addition to the cold start. Indeed, cold measurements include JIT, and old packages run on the new runtime, so this line has a higher error margin than the others.
Only LoggerFactory is definitely confirmed: +49%.
The most significant change occurred in 8.0
In the debate, it's usually said "it was better before neural networks", so let's look at the steps between adjacent releases.
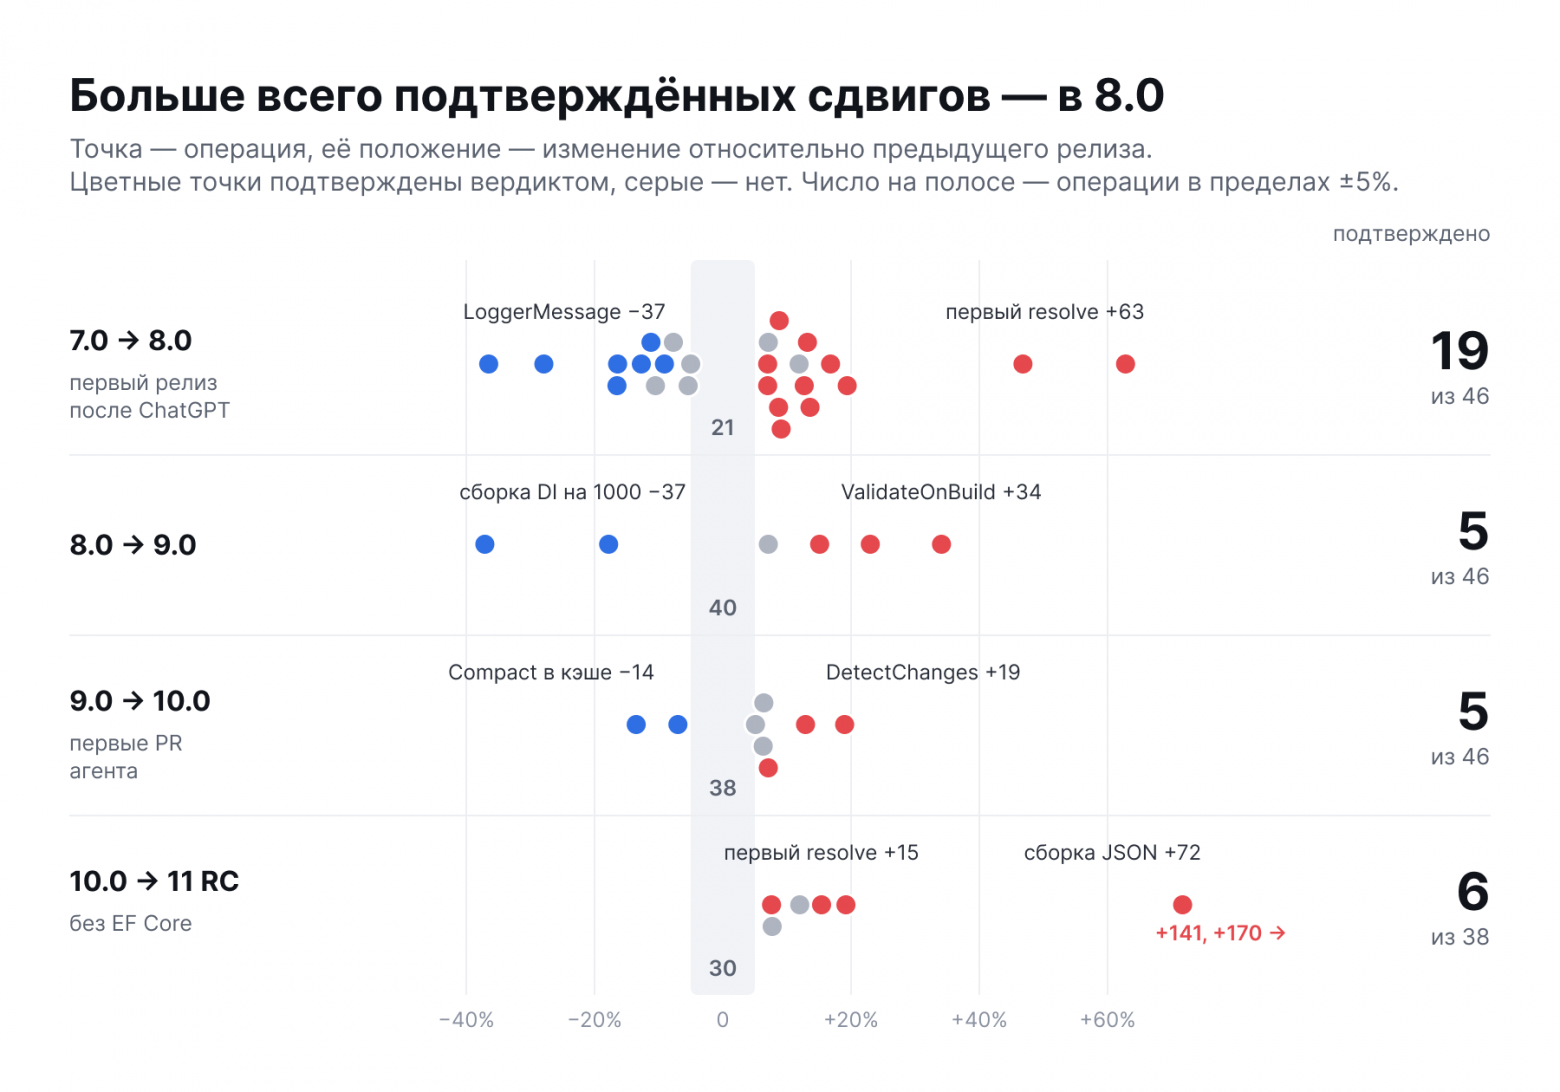
The verdict rules here are the same, only the base is the previous release: 19 out of 46 shifts confirmed for the step to 8.0, 5 for the steps to 9.0 and 10.0, and 6 out of 38 for the step to 11 RC. The step to 10.0 doesn't stand out against the previous one, although the agent only caught the last half year of its development.
On the factory settings of 8.0, it's not highlighted (8, 7, 5, and 6): there are only 11 rounds in total, and the intervals are much wider. However, the step to 11 RC does match. In both modes, 6 shifts are confirmed, and 5 out of 6 operations are common.
There is an objection to the transition to 8.0. Each major version of the package brings its own build: lib/net7.0 for 7.x, lib/net8.0 for 8.x, although the runtime is always .NET 10. This means that the step includes conditional compilation branches, which the old build cannot even see on the new runtime. This is also library code, but such a design does not allow separating the changes and the target framework switch.
Three operations stand out on the step to 10.0. The new DbContext increased by 13%, Compact in the cache decreased by 13%, and DetectChanges became 19% slower than in 9.0, losing part of its performance gain: compared to 7.0, it was −41%, now it's −30%.
The fact that the largest shift occurred in the first release after ChatGPT says nothing about AI involvement: measurements show what changed and when, but not why.
Agent: Before 10.0, there was no Agent in the hot methods of DI and cache, but in 11.0 it appeared there.
Each commit related to DI and Caching.Memory between tags v7.0.20 and v10.0.14 is matched with its pull request. The Agent is easy to identify: the PR opens the GitHub application copilot-swe-agent with ID 198982749, and the Co-authored-by trailer remains in squash commits.
113 commits: 57 from organization members, roughly Microsoft, 56 from the community, none from the agent, and none with co-authors from the agent;
24 hot methods tracked via git log -L: 39 changes, none of which are from the agent, and 8 methods between these tags remained unchanged entirely;
6 PRs with the label tenet-performance, all written by humans.
The planned comparison of "methods touched by the agent versus methods touched only by humans" on this window could not be conducted: the first group is empty. However, the window ended at 10.0, and the agent's full development cycle was only in 11.0. Therefore, I extended the markup to RC3 and added the remaining libraries. Here only the commit author in Git is considered, without splitting into Microsoft and community:
Library | 7.0 → 10.0, commits | of which agent | 10.0 → 11 RC, commits | of which agent |
|---|---|---|---|---|
DI | 80 | 0 | 21 | 11 |
Cache | 33 | 0 | 14 | 1 |
Configuration | 67 | 0 | 15 | 1 |
Options | 37 | 0 | 7 | 0 |
Logging | 52 | 1 | 8 | 3 |
EF Core | 867 | 29 | 256 | 7 3 |
Part of the agent commits in DI — documentation and annotations, but not all: out of 11 hot method DI and cache fixes in the new window, 3 belong to the agent. Additionally, in 5 commits related to configuration and Options, there is a co-author Copilot CLI.
Notes to the table:
I have only verified the actual involvement in binder and DI, which are discussed below. EF Core was just counted, although the agent's changes are the most there, and on the step to 10.0, its DbContext and DetectChanges have noticeably shifted.
An agent commit means "PR was opened by the agent", not "written without a person": such PRs go through review and are merged by people. The assistant in the IDE doesn't leave any traces in Git, so there's nothing to say about the assistant era in the data.
The epoch boundary is conditional. Copilot auto-completion appeared as early as 2021, so 7.0 might have been written without AI to some extent.
The division between Microsoft and the community is rough: it is based on the author_association field, and employees with hidden membership in the organization end up in the community. In 24 out of 113 commits, this field differs from the @microsoft.com email.
The biggest drop in 11 RC is in one line
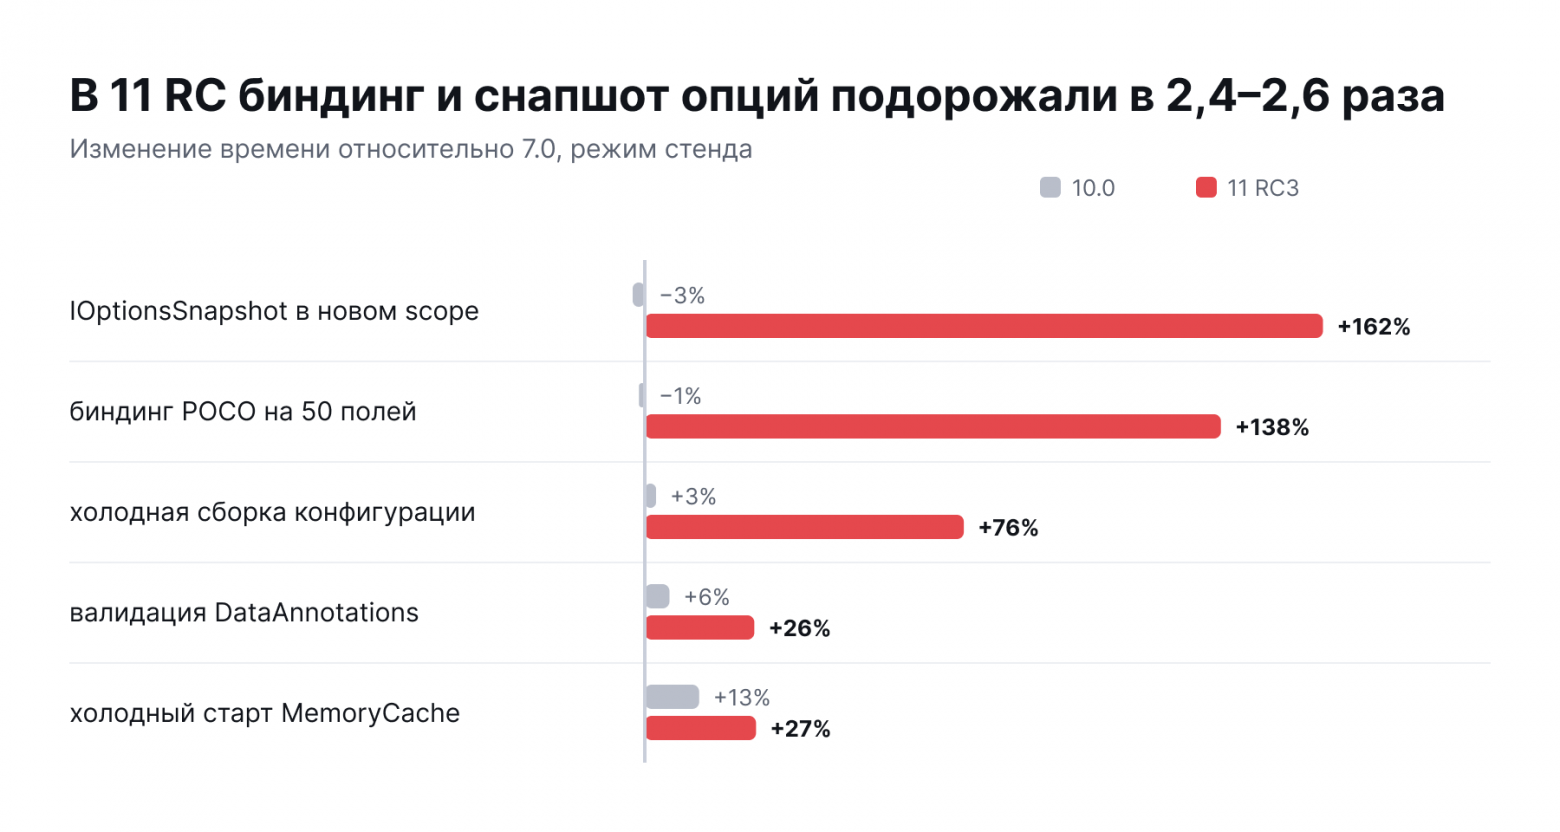
Compared to 7.0, the POCO binding on 50 fields increased from 61 to 145 microseconds, IOptionsSnapshot in the new scope — from 52 to 136 microseconds. Allocations for both operations increased almost equally, about 10 KB per call. The picture is the same on factory settings: +134% and +158%.
A 10 KB increase for 50 properties suggests that we are paying for each property. In ConfigurationBinder.cs between 10.0 and RC3 there are only 7 commits, and one of them, #126396, with a new [ConfigurationIgnore] attribute, adds exactly such a check:
private static bool IsIgnoredProperty(PropertyInfo property) => property.IsDefined(typeof(ConfigurationIgnoreAttribute));It is executed for each property during each binding. To verify the hypothesis, I built a binder from RC3 sources with this expression changed to false and replaced one DLL in the already built setup. The same scenarios, 6 rounds, setup mode:
Operation | 10.0 | 11 RC | 11 RC, line replaced |
|---|---|---|---|
Binding POCO | 61 ms | 148 ms | 60 ms |
IOptionsSnapshot in new scope | 51 ms | 139 ms | 53 ms |
DataAnnotations validation | 43 ms | 53 ms | 43 ms |
Binding allocations per call | 18.4 KB | @@ TAG492@@28,4 KB | 18,4 KB |
One line explains three of the six confirmed shifts of this step. It does not address the cold configuration assembly (+76%), the cause is different there and has not been found yet. Separately, I tested this in BenchmarkDotNet, without my tracer, on a minimal example:
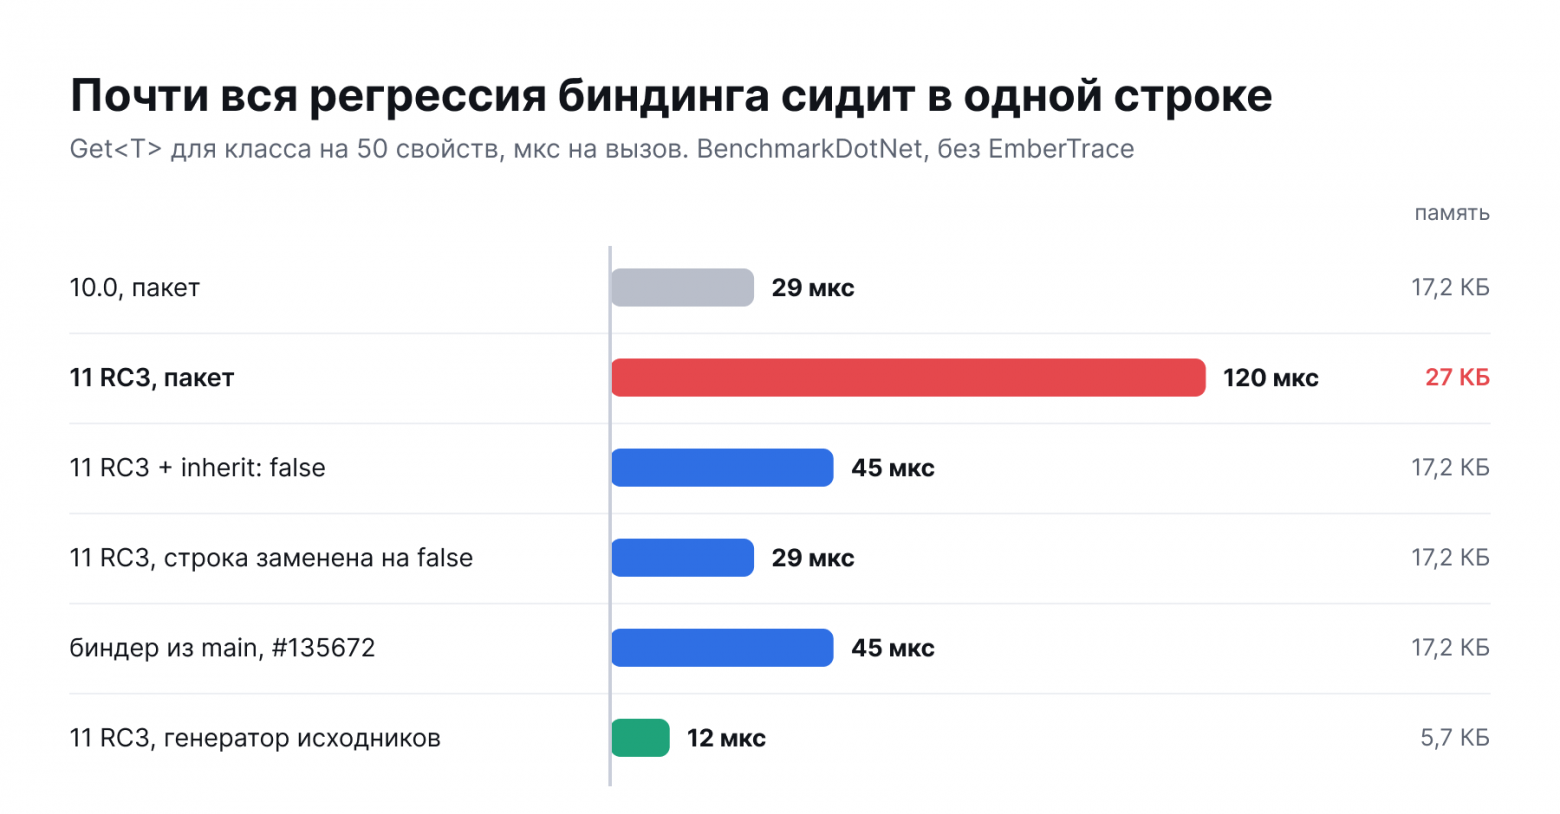
The main cost is due to the extension overload: it has inherit: true by default. With inherit: false, the time drops from 120 to 45 microseconds, and allocations return to the level of 10.0. Exactly like that is written in main after #135672, but that PR fixes another error and did not merge into the release/11.0 branch. I created issue #136759 with an example and these numbers. BenchmarkDotNet's dotnet/performance seems to miss this: their binding test uses a class with one property.
The maintainer replied on the same day. They acknowledged the regression (the issue received the regression-from-last-release label), but stated directly: the performance of the reflection binder is not a top priority, and they recommend using the source generator for hot paths. They promised to mitigate most of the regression in main and offer a fix for backporting to 11.0, while calling IOptionsSnapshot a separate issue already discussed in #53793. Later, a draft PR #136899 appeared: it examines the virtual flags of the getter and setter and triggers a cheap attribute search without inheritance if the property cannot be overridden. According to the author's numbers, Get<T> on 50 properties takes 10.3 microseconds versus 27.6 microseconds in the affected assembly and 9.4 microseconds in the 10.0 binder, allocations return to 17.5 KB. There remains about 10–15% to 10.0, that is, type caching, which I proposed, this PR does not replace or include. At the time of writing the PR is not merged and has no review, so whether the fix will make it into 11.0 is unknown. This is also indirectly indicated by the milestone: the issue is tied to 12.0.0, not 11.0, so the backport is promised but not guaranteed.
The PR was opened by an organization member, the feature was implemented based on an approved API request, and there is no Copilot trace in the commit. This does not prove that AI was not used: the assistant in the IDE is not visible in Git.
If you are already on RC, there is a workaround: the source generator (EnableConfigurationBindingGenerator) in the same example gives 12 microseconds and 5.7 KB, that is, faster than 10.0 (29 microseconds), and any reflection binder variant. Exactly this is what the maintainers recommend for performance-sensitive scenarios, so you shouldn't expect the difference in the reflection path to be completely eliminated. IOptionsSnapshot intentionally recreates options for each scope, and back in 2021, David Fowler called it a performance trap. Where configuration updates within a request are not needed, IOptionsMonitor is cheaper and without this regression.
Note: this is a release candidate, and in the main track, the build works with net10.0 from the 11.0 sources on .NET 10 runtime, so the numbers may differ on real net11.0.
Another performance hit was introduced by the agent, and this is the trade-off.
The first resolve in DI during the 11 RC step increased by another 15%. Here, the agent is indeed involved: it has 11 commits out of 21 in DI, so I built DI from the source commits and ran bisect, 8 rounds for the variant. The spike appears exactly on one commit:
DI build | First resolve, 100 providers |
|---|---|
10.0, package | 0.565 ms |
Commit before #124331 | 0.554 ms |
#124331, PR agent | 0.641 ms |
11 RC3, package | 0.653 ms |
11 RC3 with rollback only #124331 | 0.569 ms |
Within the round, the commit gives +16.5% (95% interval 14.3–18.8, all 8 rounds in one direction), and the rollback to RC3 returns to the level of 10.0: difference +1.9%, interval includes zero. On cold resolve, allocations grow from 8848 to 9080 bytes. Warm singleton, scoped, and provider assembly are not affected by the commit. This PR fixes a deadlock in cyclic dependencies through factories. Now VisitRootCache maintains a [ThreadStatic] HashSet of those currently being resolved by the thread. The cost is approximately 0.9 microseconds per first resolve in the new provider, and for the fixed deadlock, this is a reasonable price. The PR has passed review and been merged by people. In my list of 24 hot methods, VisitRootCache was not present, so the method-based profiling missed this case, and it was found only by bisect. Other agent changes to hot methods, such as rewritten constructor selection, do not affect this scenario: there is only one constructor there. Other scenarios I haven't checked like that.
Second track: net10.0 versus net11.0
Here the library and runtime change together, and there are good news: Kestrel starts 54% faster, cold EF connection with schema creation is 15–17% faster. DetectChanges, on the contrary, is 11–12% slower. Request processing time in ASP.NET Core increased by 81–90%, but I don't trust this number yet: the distribution is multimodal, the built-in load generator works with a fixed frequency, and bombardier wasn't launched.
What is all this attributed to
EmberTrace — my tracer for .NET under MIT license, the package is available on NuGet. All main measurements in the article are a single stack trace for a bunch of calls, as in the example at the beginning: thousands of processes, each leaving a .ember file, and the comparison is built based on the files.
The tracer itself did not name the culprit: the shift was shown by measurements, the suspect was found via git log, and confirmed by DLL substitution. Fortunately, a stack trace can be placed directly into someone else's code and see where the time goes. I added four stack traces into the binder's source code:
private static bool IsIgnoredProperty(PropertyInfo property) { using var scope = Tracer.Scope(Tracer.Id("ConfigurationBinder.IsIgnoredProperty")); return property.IsDefined(typeof(ConfigurationIgnoreAttribute)); }Here is the TraceText.Write report for 20 packages of 1000 bindings:
Name Count Incl ms Excl ms Excl% bind.x1k 20 2958.218 192.096 6.44 ConfigurationBinder.BindProperties 20000 2766.122 356.338 11.95 ConfigurationBinder.IsIgnoredProperty 1000000 1813.144 1813.144 60.80 ConfigurationBinder.BindProperty 1000000 551.475 551.475 18.49 ConfigurationBinder.GetAllProperties 20000 45.165 45.165 1.51Million calls and 61% of time spent on attribute checking, which doesn't exist in this class. Four million events were written in 3 seconds, none were lost. This has a cost: with scopes, binding took 148 microseconds versus 120 microseconds in the benchmark, that is roughly 0.3 microseconds per scope including hashing the name in Tracer.Id, so the figures are approximate. For such a one-time diagnostic, this is acceptable, but I wouldn't use scopes in production for every call.
Memory allocations are more reliable than time
Bytes per batch are almost deterministic and don't depend on frequency, so this is the most reliable signal in the set.
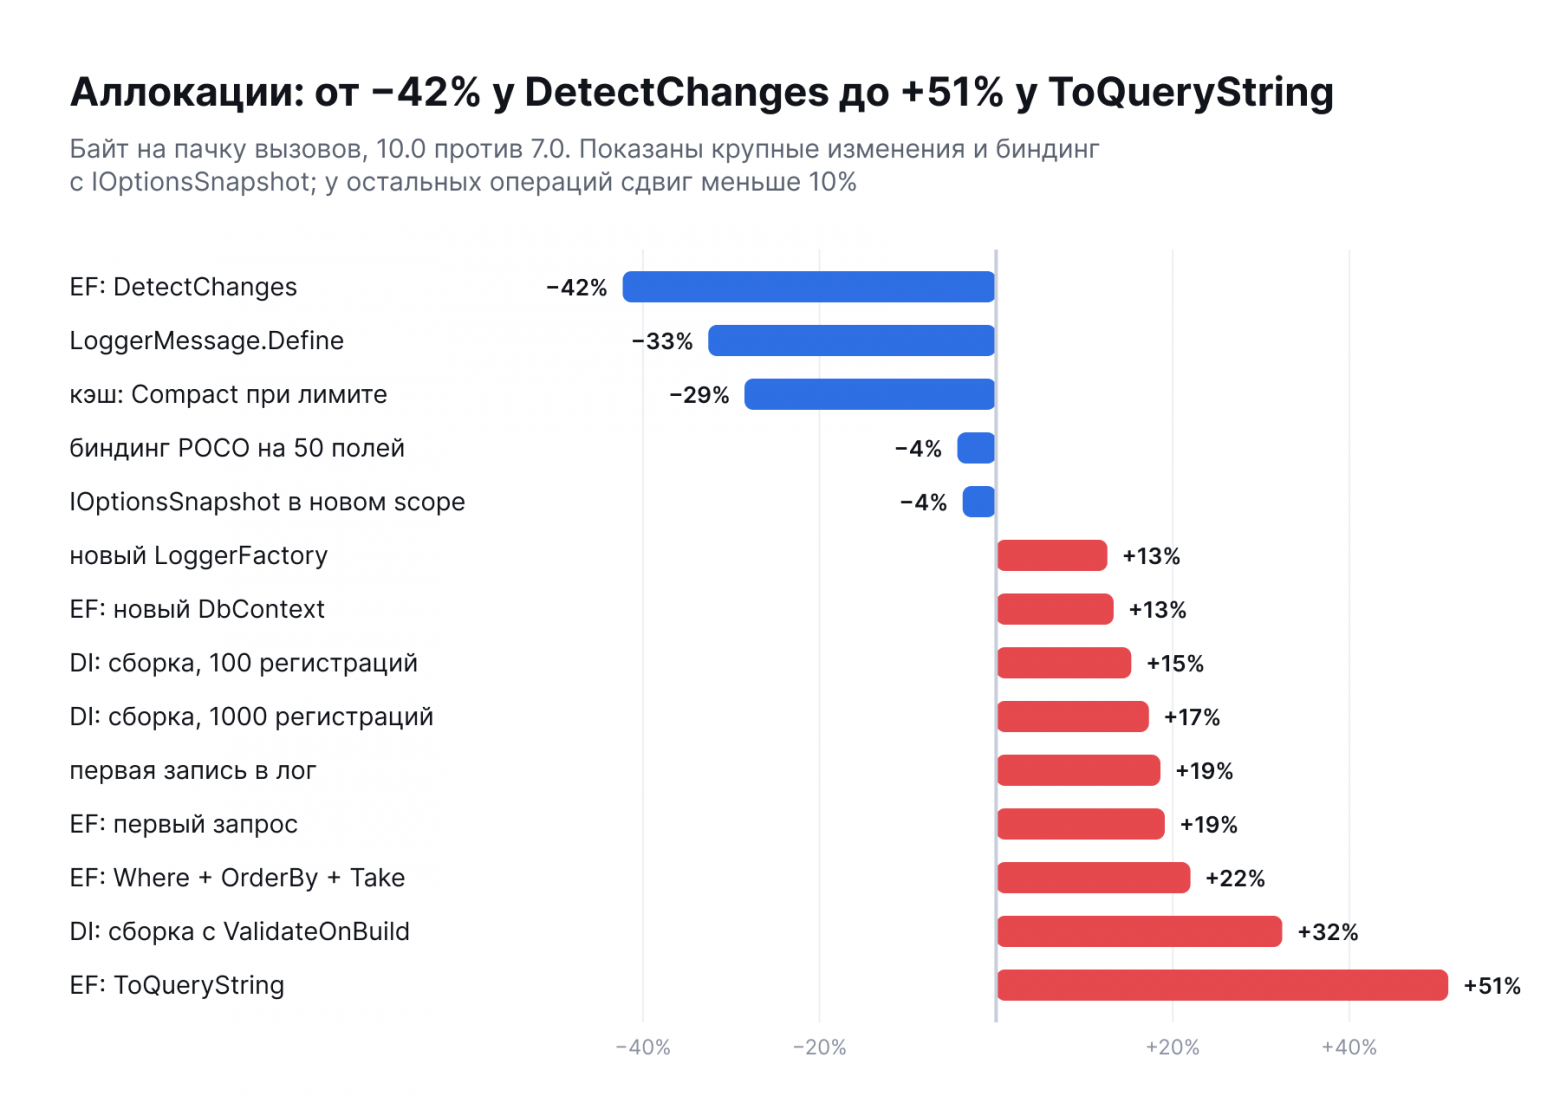
Memory and time often go hand in hand: LoggerMessage and DetectChanges have less of both, ValidateOnBuild and DbContext have more. But it's not always the case. Where + OrderBy + Take in EF allocates 22% more memory with time within the noise (+1.7%): in an application, this is likely to show up later as extra GC work. Building a DI provider on 1000 registrations requires 17% more memory, although its average time dropped by 25%.
The code is growing at the same time. Between 7.0 and 11 RC, DI code increased by 25%, Caching.Memory by 24%, DI.Abstractions by 129%, with the last one having a major spike in 8.0, where keyed services were introduced. The average cyclomatic complexity has barely changed, staying in the range of 1.3–2.5, so on average everything is fine. But the maximum complexity of the DI method increased from 14 to 23, and in DI.Abstractions from 10 to 26.
The "configured" bench turned out to be almost twice as slow.
Benchmark recommendation is standard: fix the frequency, disable turbo boost. On this processor, no_turbo limits the cores to base 2 GHz while the maximum is 4.4 GHz. As a result, all 46 operations of the base version run 1.6–2.1 times faster on factory settings than on the "correct" bench.
It's not just the absolute numbers that change, but also the relative ones:
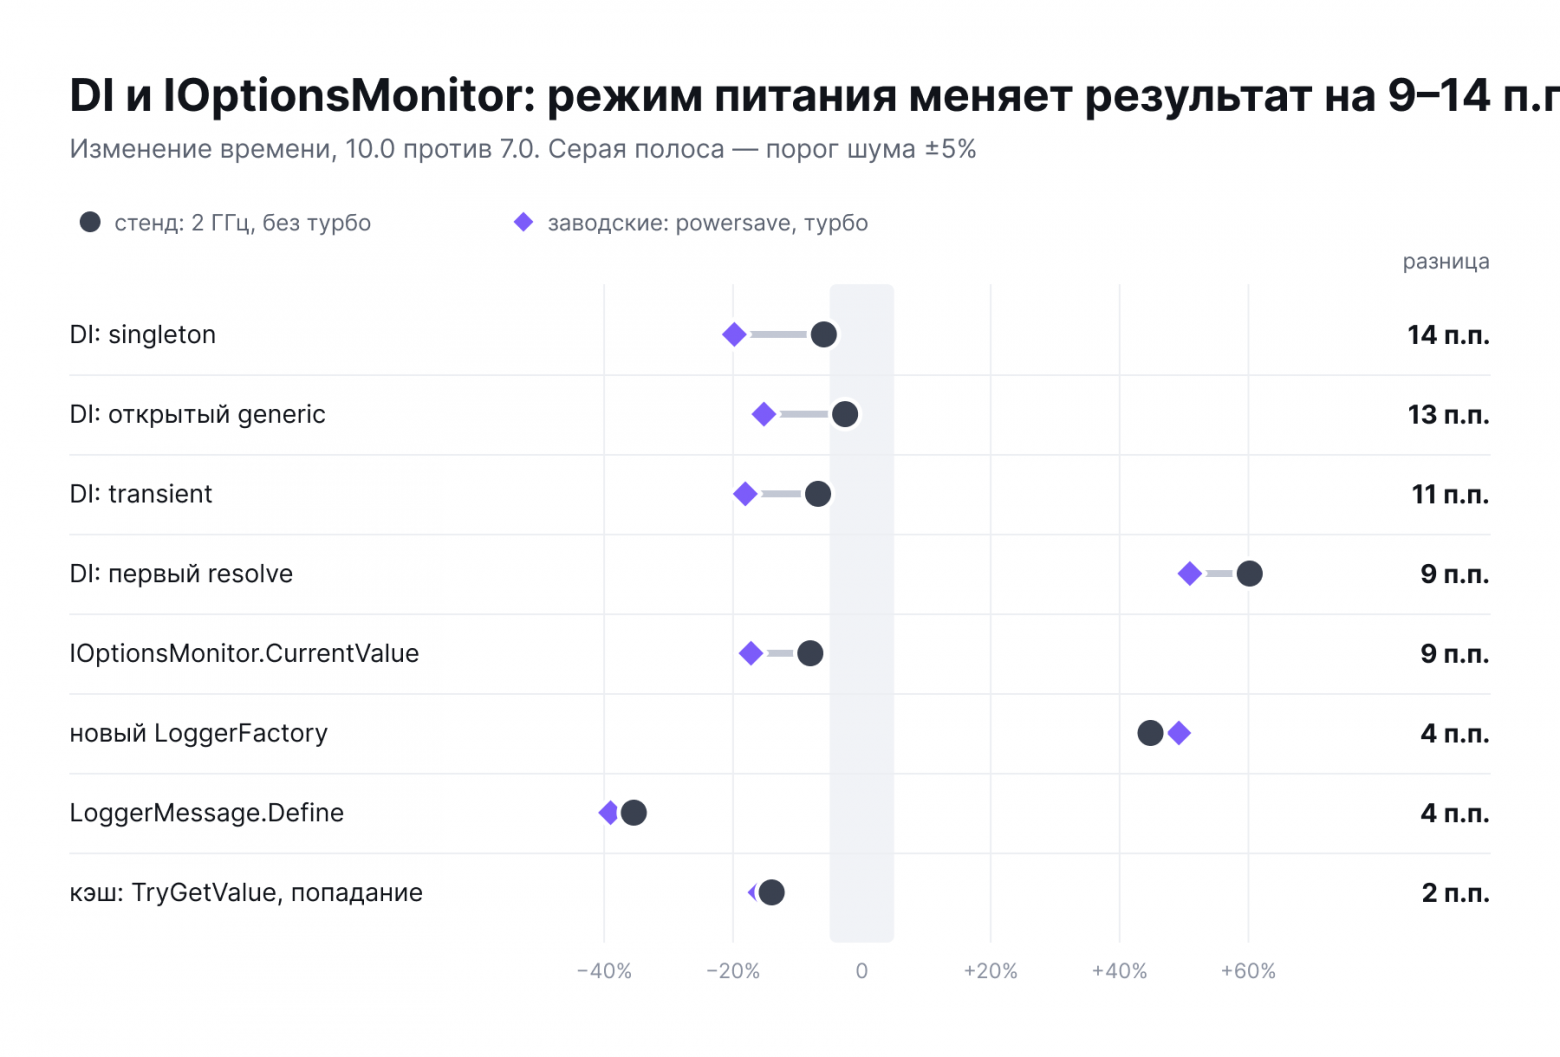
The warmed-up DI and IOptionsMonitor operations in 10.0 show a 3–8% speedup on the bench and a 15–20% speedup on factory settings. For singleton, transient, and open generic, this is the difference between "no verdict" and "definitely faster", although the code version is the same. A plausible explanation is a different ratio of core frequency and memory speed, but it wasn't checked.
You can't attribute everything to drift: bench rounds go both before and after the factory settings block. Comparing modes finds a significant difference in 29 out of 252 cases, and comparing the first and last bench rounds with each other finds a difference in one. The design is still not ideal: factory rounds are in one block, and there are fewer processes in them (33 versus 78).
Therefore, ±5% obtained on one laptop in one power mode mean little. If you are comparing versions, specify the mode, and preferably test in two.
Known limitations
I have tightened the verdict rules after the first rounds. The original rule is preserved in the data, and the deviation is described in the methodology, but the decision was still made after reviewing the data.
Everything was recorded on a laptop with a hybrid processor, without core isolation, and under an average load of mostly 1–2.7. Therefore, it's better to rely on the relationships within the round rather than on absolute times.
The result sometimes depends on the metric. For cache.set and get-or-create in 10.0, the median shows an increase of 22–31%, while the mean shows a decrease of 5–9%. I haven't identified the cause of these two mods, so I don't draw conclusions about these operations.
The synthetic measurements cover only the APIs present in all versions, so the fastest new paths didn't make it into the comparison. Old packages run on the new runtime and may not use its optimizations.
In conclusion
Updating from 7.0, which is already out of support, makes sense for the hot paths: the gain there is real. If you're using serverless or short-lived utilities, it's better to measure the cost of a cold start yourself. Before moving to 11.0, you should run your scenarios with configuration binding and IOptionsSnapshot, on the final version, not on RC, and check if the fix from #136899 made it into the release.
The answer to the original question is now: in what I checked, there are no signs that the code became worse due to AI, but there are also no proofs of the opposite. Before 10.0, there was no agent in the hot methods of DI and cache. In 11.0, it's there, and the only change I caught in the measurements is 0.9 microseconds per first resolve in exchange for a fixed deadlock. The largest regression in the release is one line in a person's PR for a new feature.
EF Core remains open, where the agent has the most fixes, cold configuration build, and how much of this will change by the final release.
Code bench, data, and methodology: dotnet-ai-era-benchmarks.