My name is Anton Sokolov, an independent industry analyst. I write about how Russian industrial companies are replacing foreign software. Previously, I analyzed Kamaz and its replacement module Teamcenter, then a neural network for oil additive recipes. This time, I'm focusing on hydraulic fracturing simulators: "CyberFRP" by Gazprom Neft and "RN-GRID" by Rosneft. I don't have access to the actual programs, so I compare them based on open materials from their authors and add what they are missing.
Why is a fracture needed in the rock
Oil is located in the pores of the rock. If the rock doesn't allow fluid to pass well, very little oil reaches the well. During hydraulic fracturing (HF), fluid is injected under pressure into the well, causing the rock to crack and making it easier for oil to flow to the well. Along with the fluid, proppant is added: these are granules that prevent the fracture from closing after the pressure is reduced.
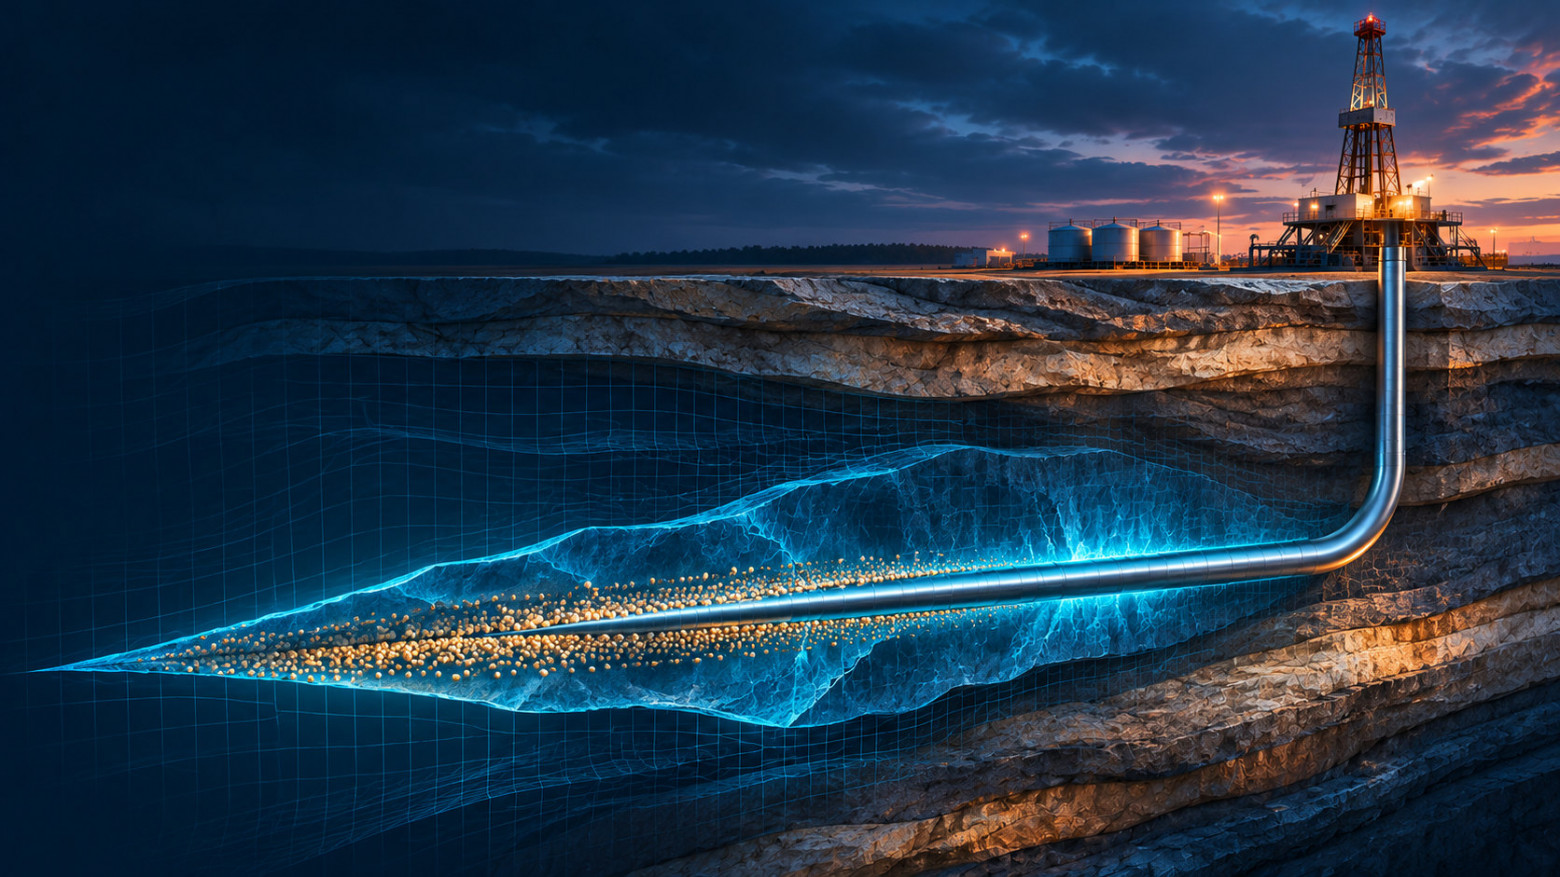
Artistic illustration of the process. Not a result of the "CyberFRP" calculation.
A fracture may grow in the wrong direction, for example, reaching the water-bearing layer. In the 2018 description of "CyberFRP" by Polytechnic, they explicitly mentioned this risk as the reason why operations need to be calculated first. Developers modeled fracture growth, fluid flow, and proppant transport.
You can't see the rock formation at depth, so the engineer works with a forecast. He changes the injection parameters and checks what the model predicts. How accurate the prediction is will only be clear from measurements during and after the operation.
What the simulator needs to know before calculating
In the "CyberГРП" card in the ComNews developments catalog for 2026, data blocks are listed. If reduced to user tasks, it results in such a table.
Data | Why are they needed |
|---|---|
Well trajectory and pipe characteristics | Calculate the path of the mixture and pressure losses |
Formation geometry and rock properties | Describe the environment in which the fracture grows |
Well geophysical studies | Build a geomechanical model: rock properties and stresses |
Fluid and proppant characteristics | Calculate their movement along with the fracture growth |
Records of actual injection | Compare the forecast with measurements and refine the model |
Until the calculation itself, the analyst has their own work. Need to check that the exports belong to one well, that the units of measurement match, and that missing values don't spoil the picture. An error in data preparation looks like an error in the physical model. The program will calculate everything without objections, but the engineer will receive a response about the incorrectly described object.
The card mentions Python API and user scripts for data processing. Documentation on API methods is needed for a specific script. There is no documentation in the card, so I cannot judge what exactly can be automated.
The fracture grows while fluid flows through it.
In the description of "CyberGRP," a coupled calculation is indicated: fluid and proppant flow in the wellbore is calculated together with fracture growth. The calculation is called coupled because the processes influence each other. Fluid pressure pushes against the rock, the fracture opens, and changes the space through which the fluid flows. If the fracture shape is fixed and only the flow is calculated, the fracture growth during injection will be omitted.
To demonstrate why multiple runs are needed, I'll take a hypothetical example (there are no published "Gazprom Neft" calculations here). Suppose Variant A uses fewer materials, while Variant B changes the fluid delivery mode and proppant distribution across stages. With the accepted rock permeability (i.e., how easily it allows fluid flow), Variant B provides a higher predicted inflow. When permeability is refined within acceptable limits, the difference between A and B disappears.
One run provides an answer for the given conditions. Multiple runs with different initial assumptions show how stable the choice is. This is called sensitivity analysis, and in hydraulic fracturing, it determines whether to use the expensive variant or first gather data.
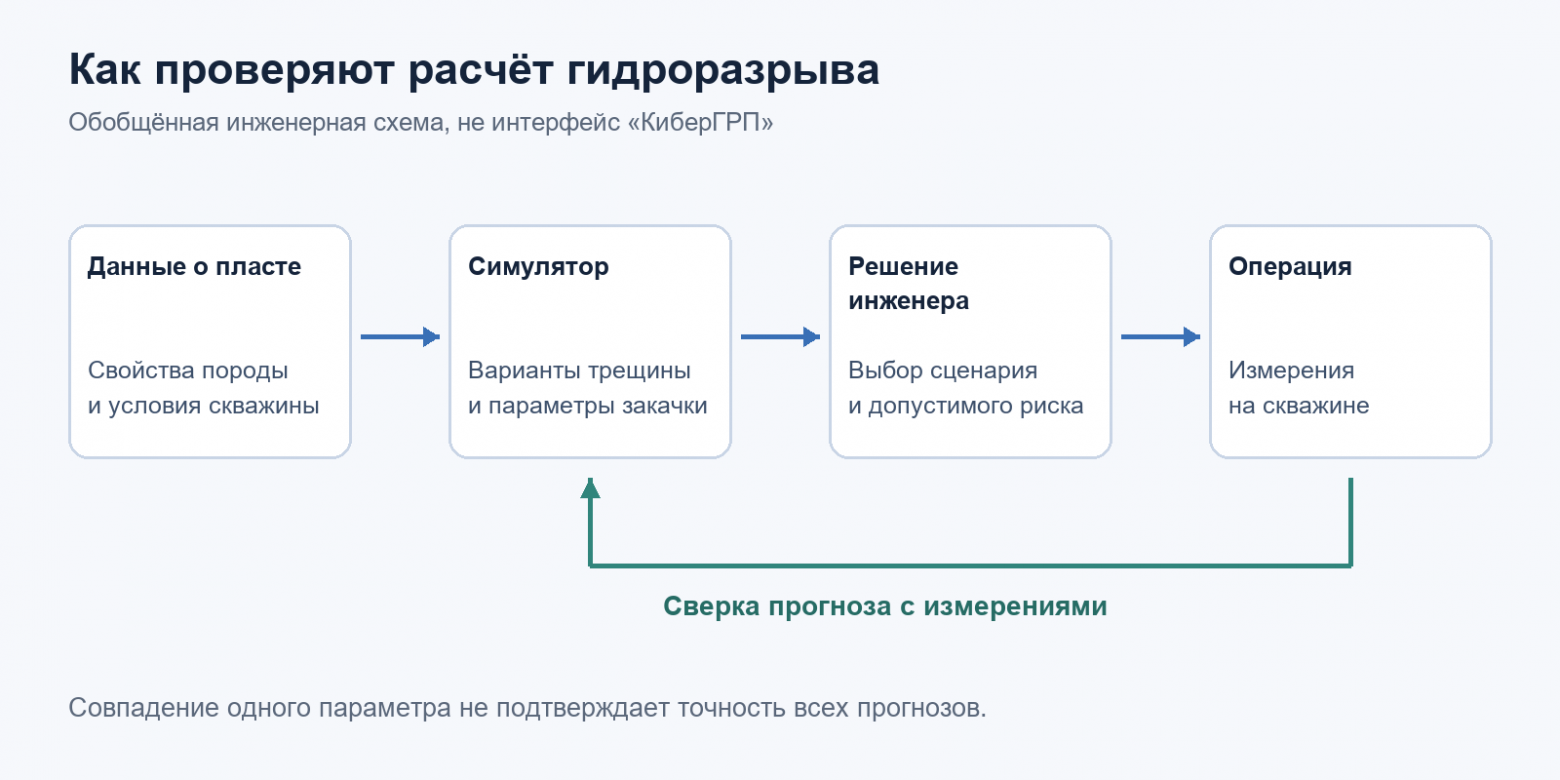
The calculation helps choose the operation, then the forecast is compared with measurements. The diagram shows the general engineering process and does not reflect the internal structure of "Kibernetika GRP."
Two simulators side by side
There is not only a hydraulic fracturing simulator at "Gazprom Neft": "RN-GRID" is used by "Rosneft." I have collected what is publicly known about both.
Kibernetika GRP ("Gazprom Neft") | RN-GRID ("Rosneft") | |
|---|---|---|
Who developed | NTC "Gazprom Neft", MIPT, Skoltech, Politekh, Institute of Hydromechanics SB RAS | RN-BashNIPIneft |
When it appeared | Project description in Politekh materials from 2018, version 2.0 in 2020 | Created in 2017, implemented in Rosneft's service division from the beginning of 2018 |
Scale of use | September 2023: more than 6000 operations in five years | February 2020: more than 10,000 operations with full design cycle in the simulator |
External users | September 2023: 12 companies were using it, another 17 were testing it | February 2020: more than 200 commercial licenses, 140 academic, more than 40 test licenses at 16 companies |
Status | In the Russian software registry (2023) |
AG204@@
Direct comparison of numbers is not possible. The dates are different: 2020 and 2023. They also calculate differently: for Rosneft, it's operations with a full cycle of design in the simulator, for Gazprom Neft, it's operations "using" the program. All the numbers are taken from the companies' own statements.
But the picture is clear: both companies have their own simulator, and both have moved beyond internal use. In the materials I found, Rosneft has more data on licenses and universities, while Gazprom Neft has more details on the composition of developers and the scientific part.
Where open materials end
Here I hit a wall. A single public example of field testing was found. On May 18, 2020, the NOC Gazpromneft-Polytech reported that using version 2.0, they prepared an alternative operation variant for complex conditions on vertical and horizontal wells of Gazpromneft-Hantos. According to the authors' statement, actual parameters, including pressure, matched the forecast.
This is a good result, but it only addresses part of the question. The coincidence of injection pressure does not prove that the fracture geometry and oil inflow matched. They are evaluated based on other data. In the open messages I found, neither Gazprom Neft nor Rosneft provide graphs of forecast vs. actual, protocols, or error margins. What assumptions had to be clarified and where the forecast diverged from observations, these materials do not reveal.
Another limitation: both data sets (and 6000 operations, and 10,000) state how often the program is used, but not how often the forecast was accurate. A second digit is needed for the injection decision.
What would I ask to show
The next analysis I would build around a single anonymous well: initial data, two scenarios, engineer selection, and overlaying forecasts on measurements. And if you work with such calculations, what verification would you require before relying on the simulator's results during a real operation?
Sources
Saint Petersburg Polytechnic University. "Development mechanisms of oil fields will be determined by the domestic simulator", 2018.
NOЦ Gazpromneft-Polytech. "Gazprom Neft successfully applies digital technologies to increase production of hard-to-produce oil", 2020.
ComNews. "Innovations for the oil and gas industry: The Ministry of Digital Development included the digital system 'CyberGRP' of Gazprom Neft in the registry of Russian programs", 2023.
ComNews. "Software developments of Russian corporations, 2026".
Neftegaz.RU. "Rosneft concluded the application of the GRP RN-GRID simulator: Everything went well", 27.02.2020.
ComNews. "Rosneft sold 200 commercial licenses for the use of the software 'RN-GRID'", 27 February 2020.