IMAP, GPT-6 Astra, xhigh level. The X-axis shows average cost per run, and the Y-axis shows the proportion of error-free runs. Interactive version on the author’s website.
Default looks good again. Some conditions yield slightly higher correctness, but they also cost more. The RFC on IMAP has not yet reached its ceiling, but we would still like to see the results on a harder task: most of the time, I work on tasks that agents most often fail to solve on the first attempt. To do this, we’ll use the pandoc experiment we discussed when comparing programming languages. I also want to look at larger tasks because models often behave quite differently on them. We saw this with “cave mode” and with the languages. In cave mode, the large gains people had reported diminished or disappeared altogether.With languages, this was immediately evident in several respects: for example, the Zstd implementations in C and C++ at least handled memory safety reasonably well, whereas the Pandoc implementations in those same languages suffered from memory problems time and time again.
Pandoc is much more complex. Even after several turns (about 14 on average), no condition reached 100% correctness, so instead of looking at the proportion of runs achieving 100%, we will look at the proportion of tests passed.
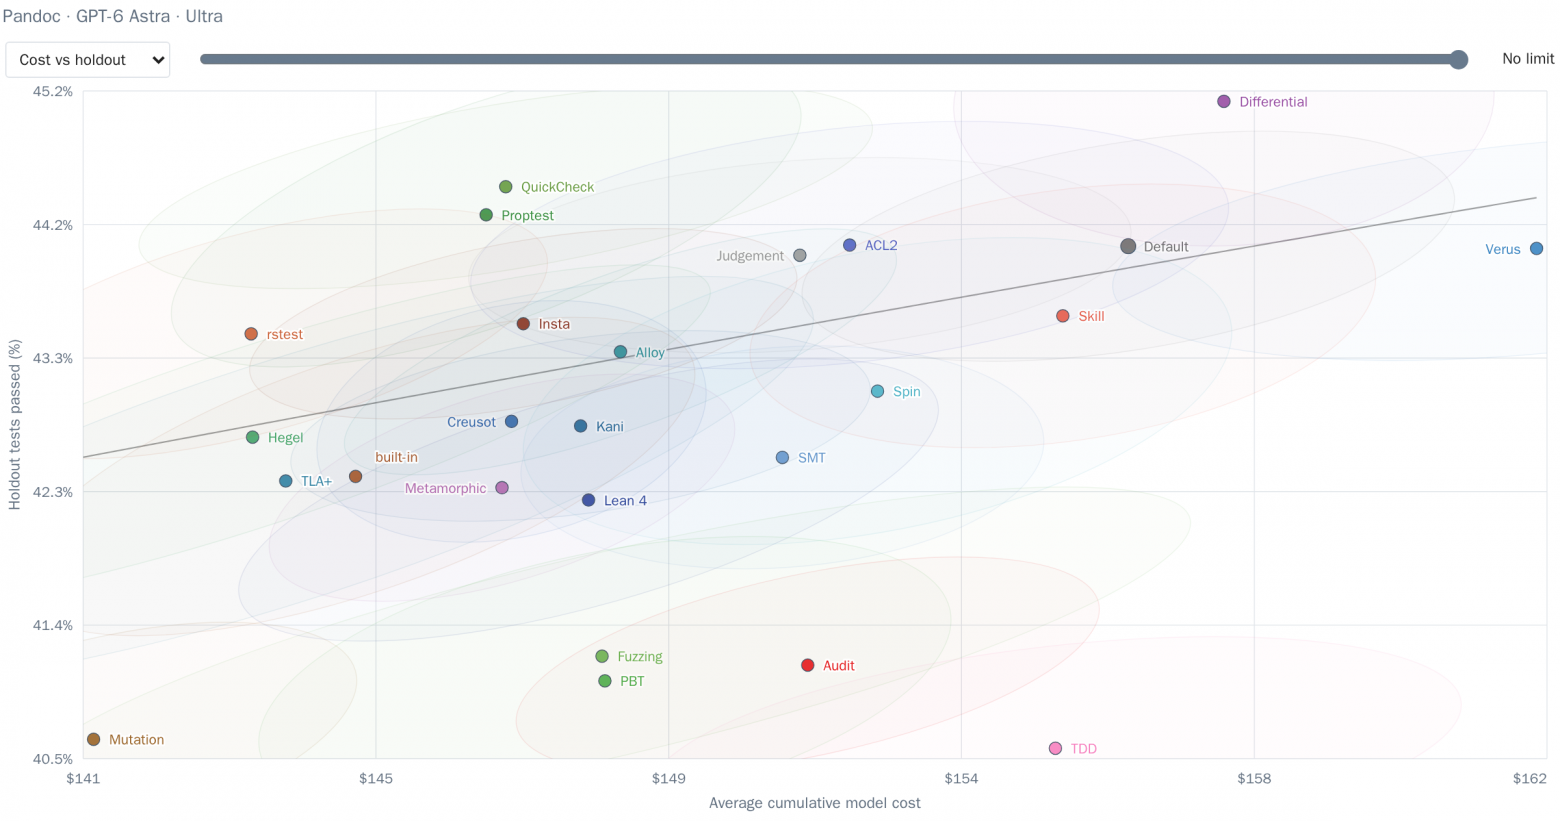
Pandoc, GPT-6 Astra, Ultra level. The x-axis shows average cumulative cost, and the y-axis shows the proportion of hidden tests passed. The line is a curve fitted to Default. Interactive version with a spending-limit slider and other slices.
Pandoc on GPT-6 Astra: proportion of visible and hidden tests passed for each condition