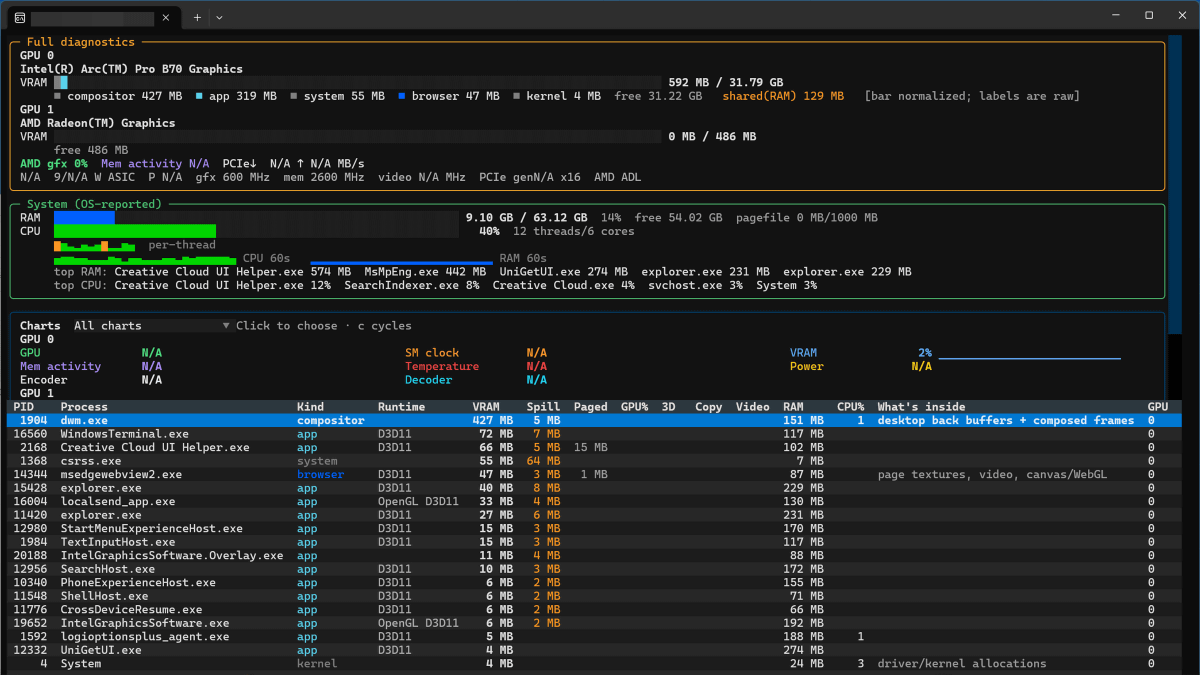
Windows' standard Task Manager cannot monitor the VRAM usage of each task. “gputaskman” is a GPU task manager developed by Microsoft's vice president Scott Hanselman, and it enables detailed monitoring of GPU usage. It seemed useful, so I tried it.
GitHub - shanselman/gputaskman: A GPU task manager for Windows, Linux, and WSL: per-process VRAM, GPU activity, and LLM model/KV-cache insights (Windows AMD and NVIDIA). · GitHub
https://github.com/shanselman/gputaskman
gputaskman is a GPU task manager for Windows, macOS, and Linux. To install and use the Windows version, first click the link below to access the binary distribution page.
GitHub - shanselman/gputaskman: A GPU task manager for Windows, Linux, and WSL: per-process VRAM, GPU activity, and LLM model/KV-cache insights (Windows AMD and NVIDIA). · GitHub
https://github.com/shanselman/gputaskman
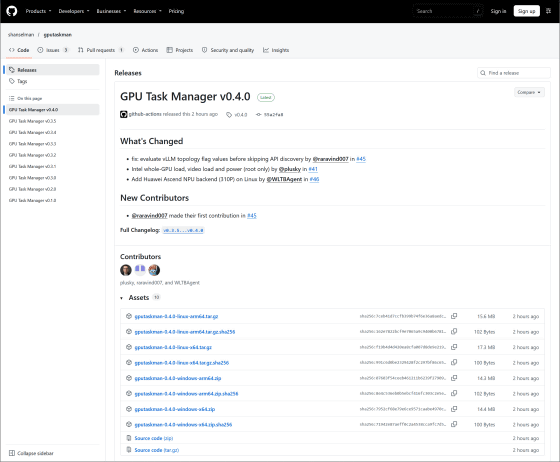
The latest version at the time of writing was 0.4.0, so click “gputaskman-0.4.0-windows-x64.zip” to download the file for Windows.
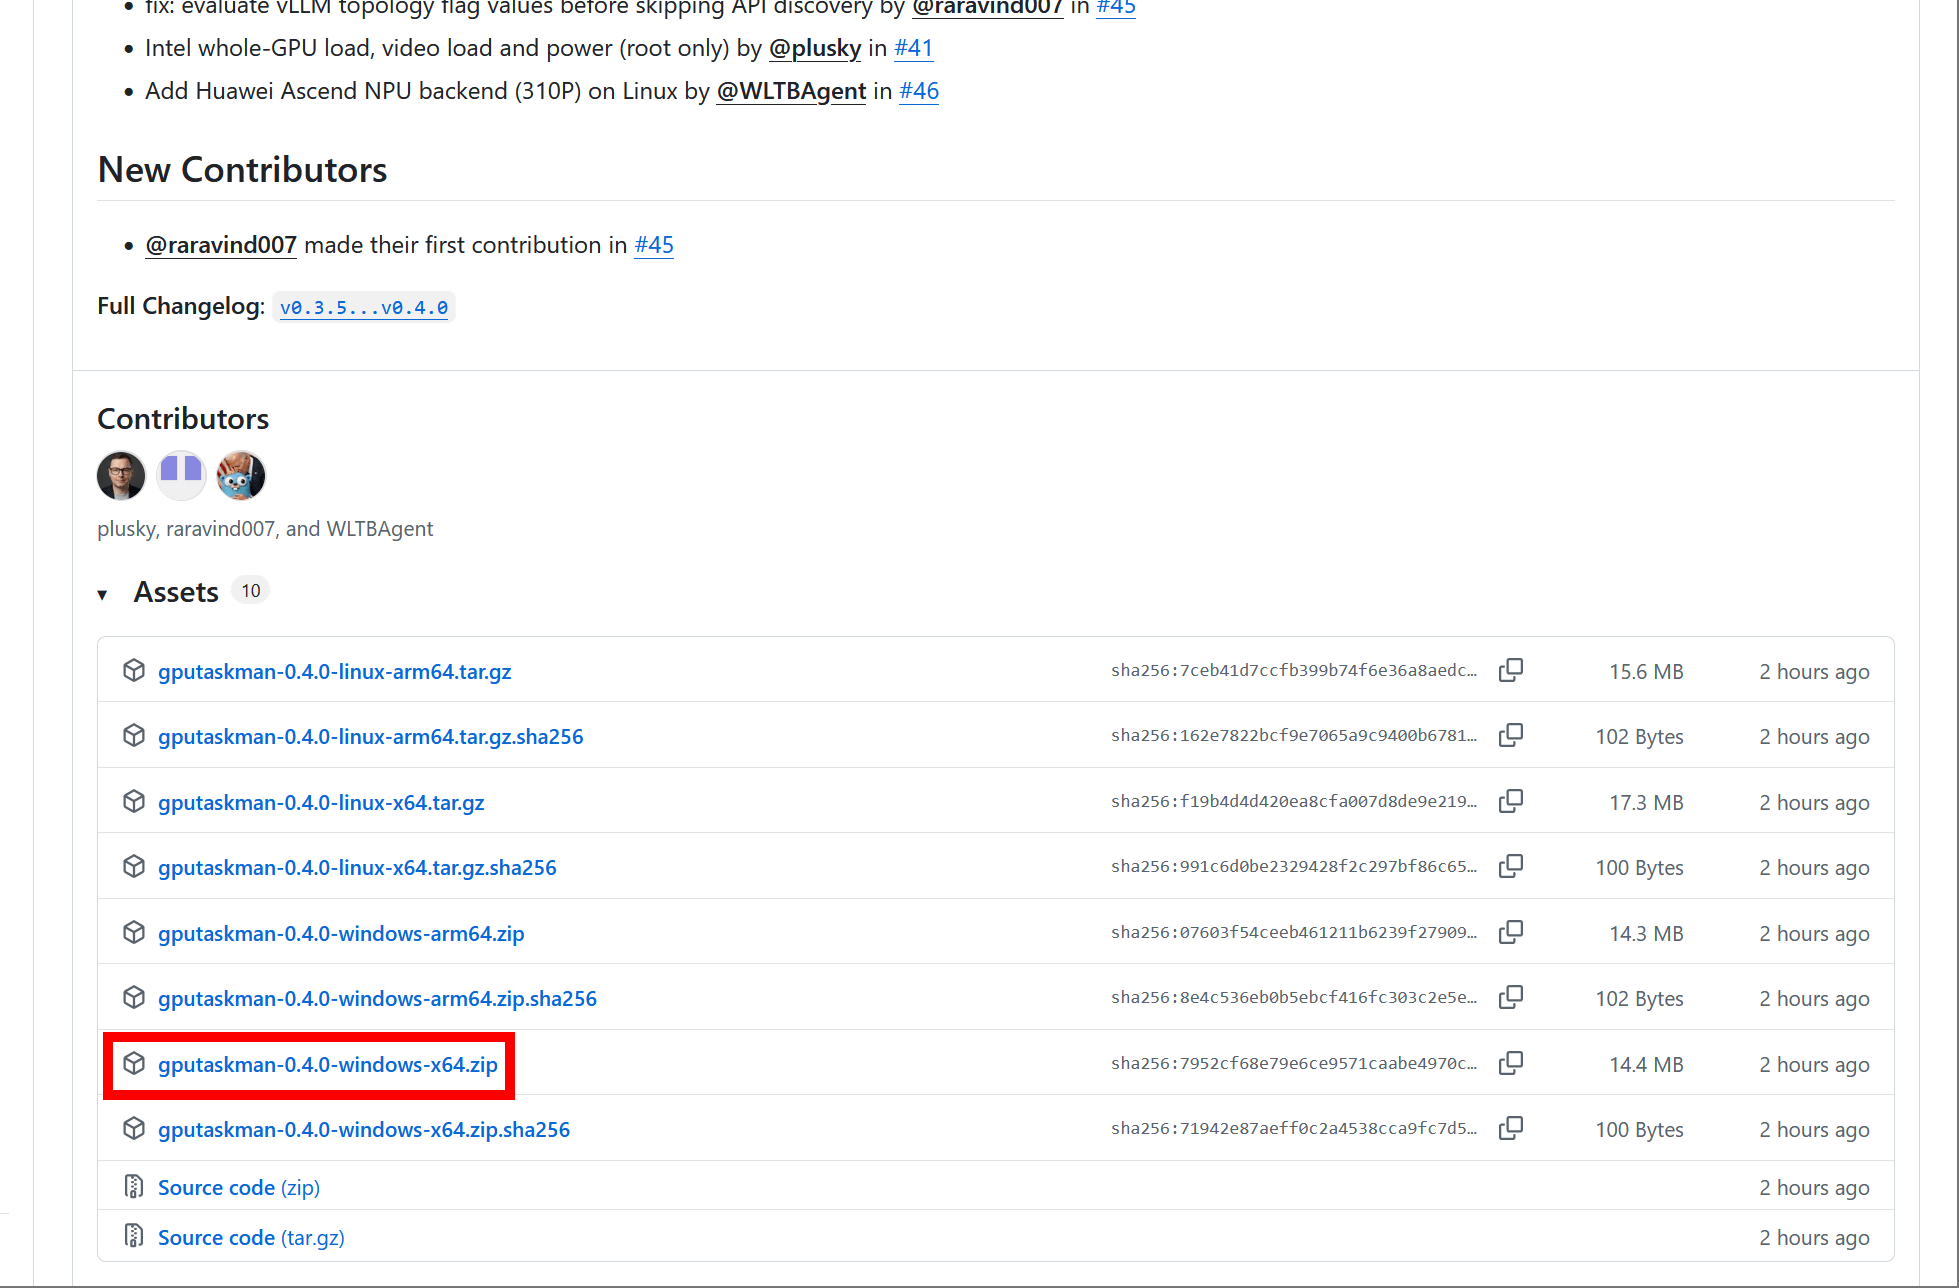
Once the ZIP file has finished downloading, extract it using standard Windows features or a compatible archive utility.
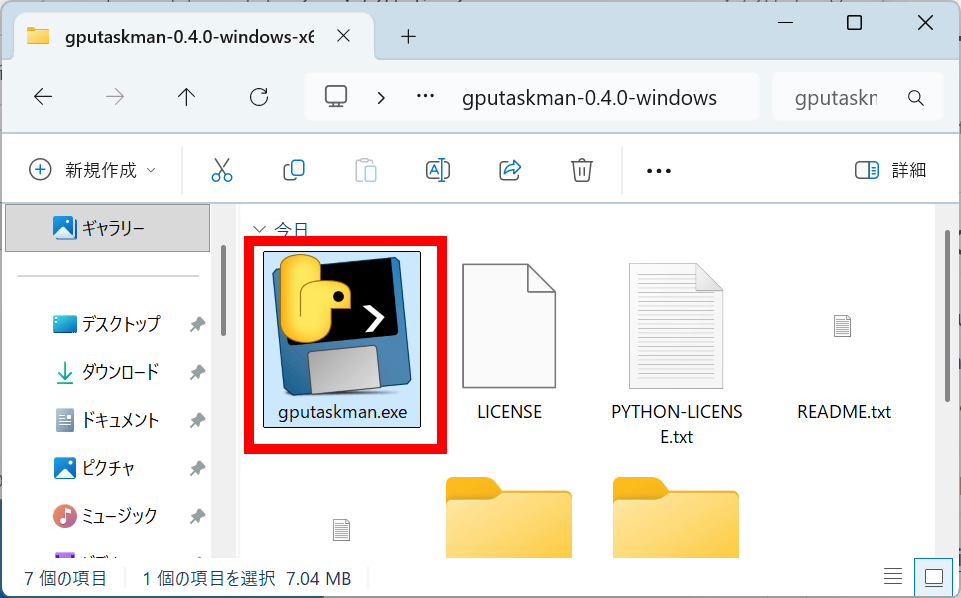
Double-click “gputaskman.exe” in the extracted folder.
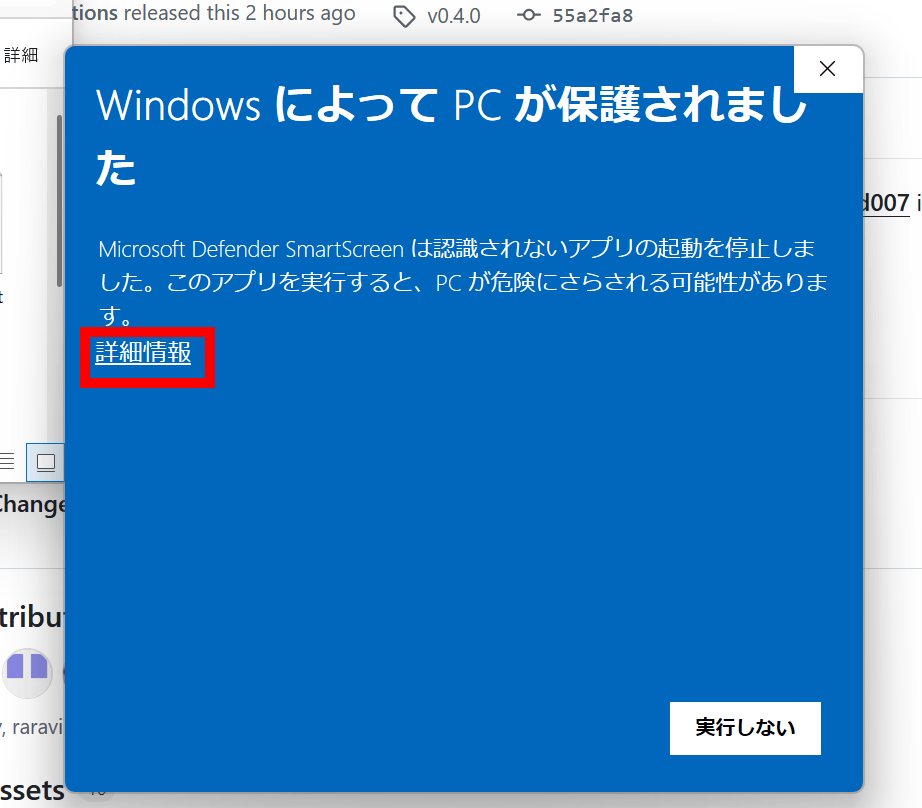
If the following warning appears, click “More info”.
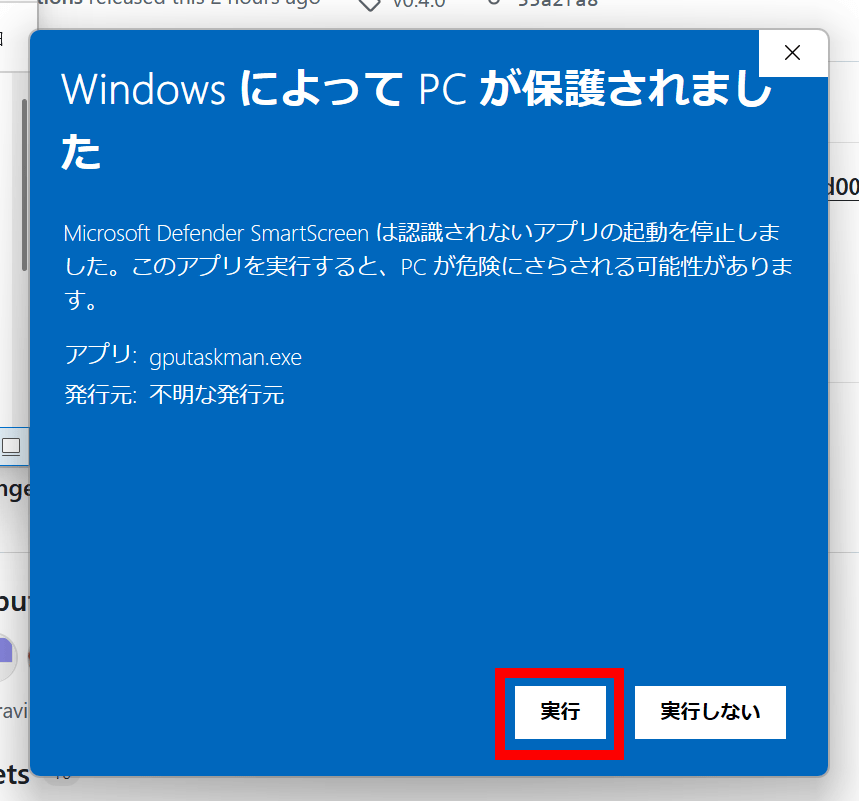
Click “Run”.
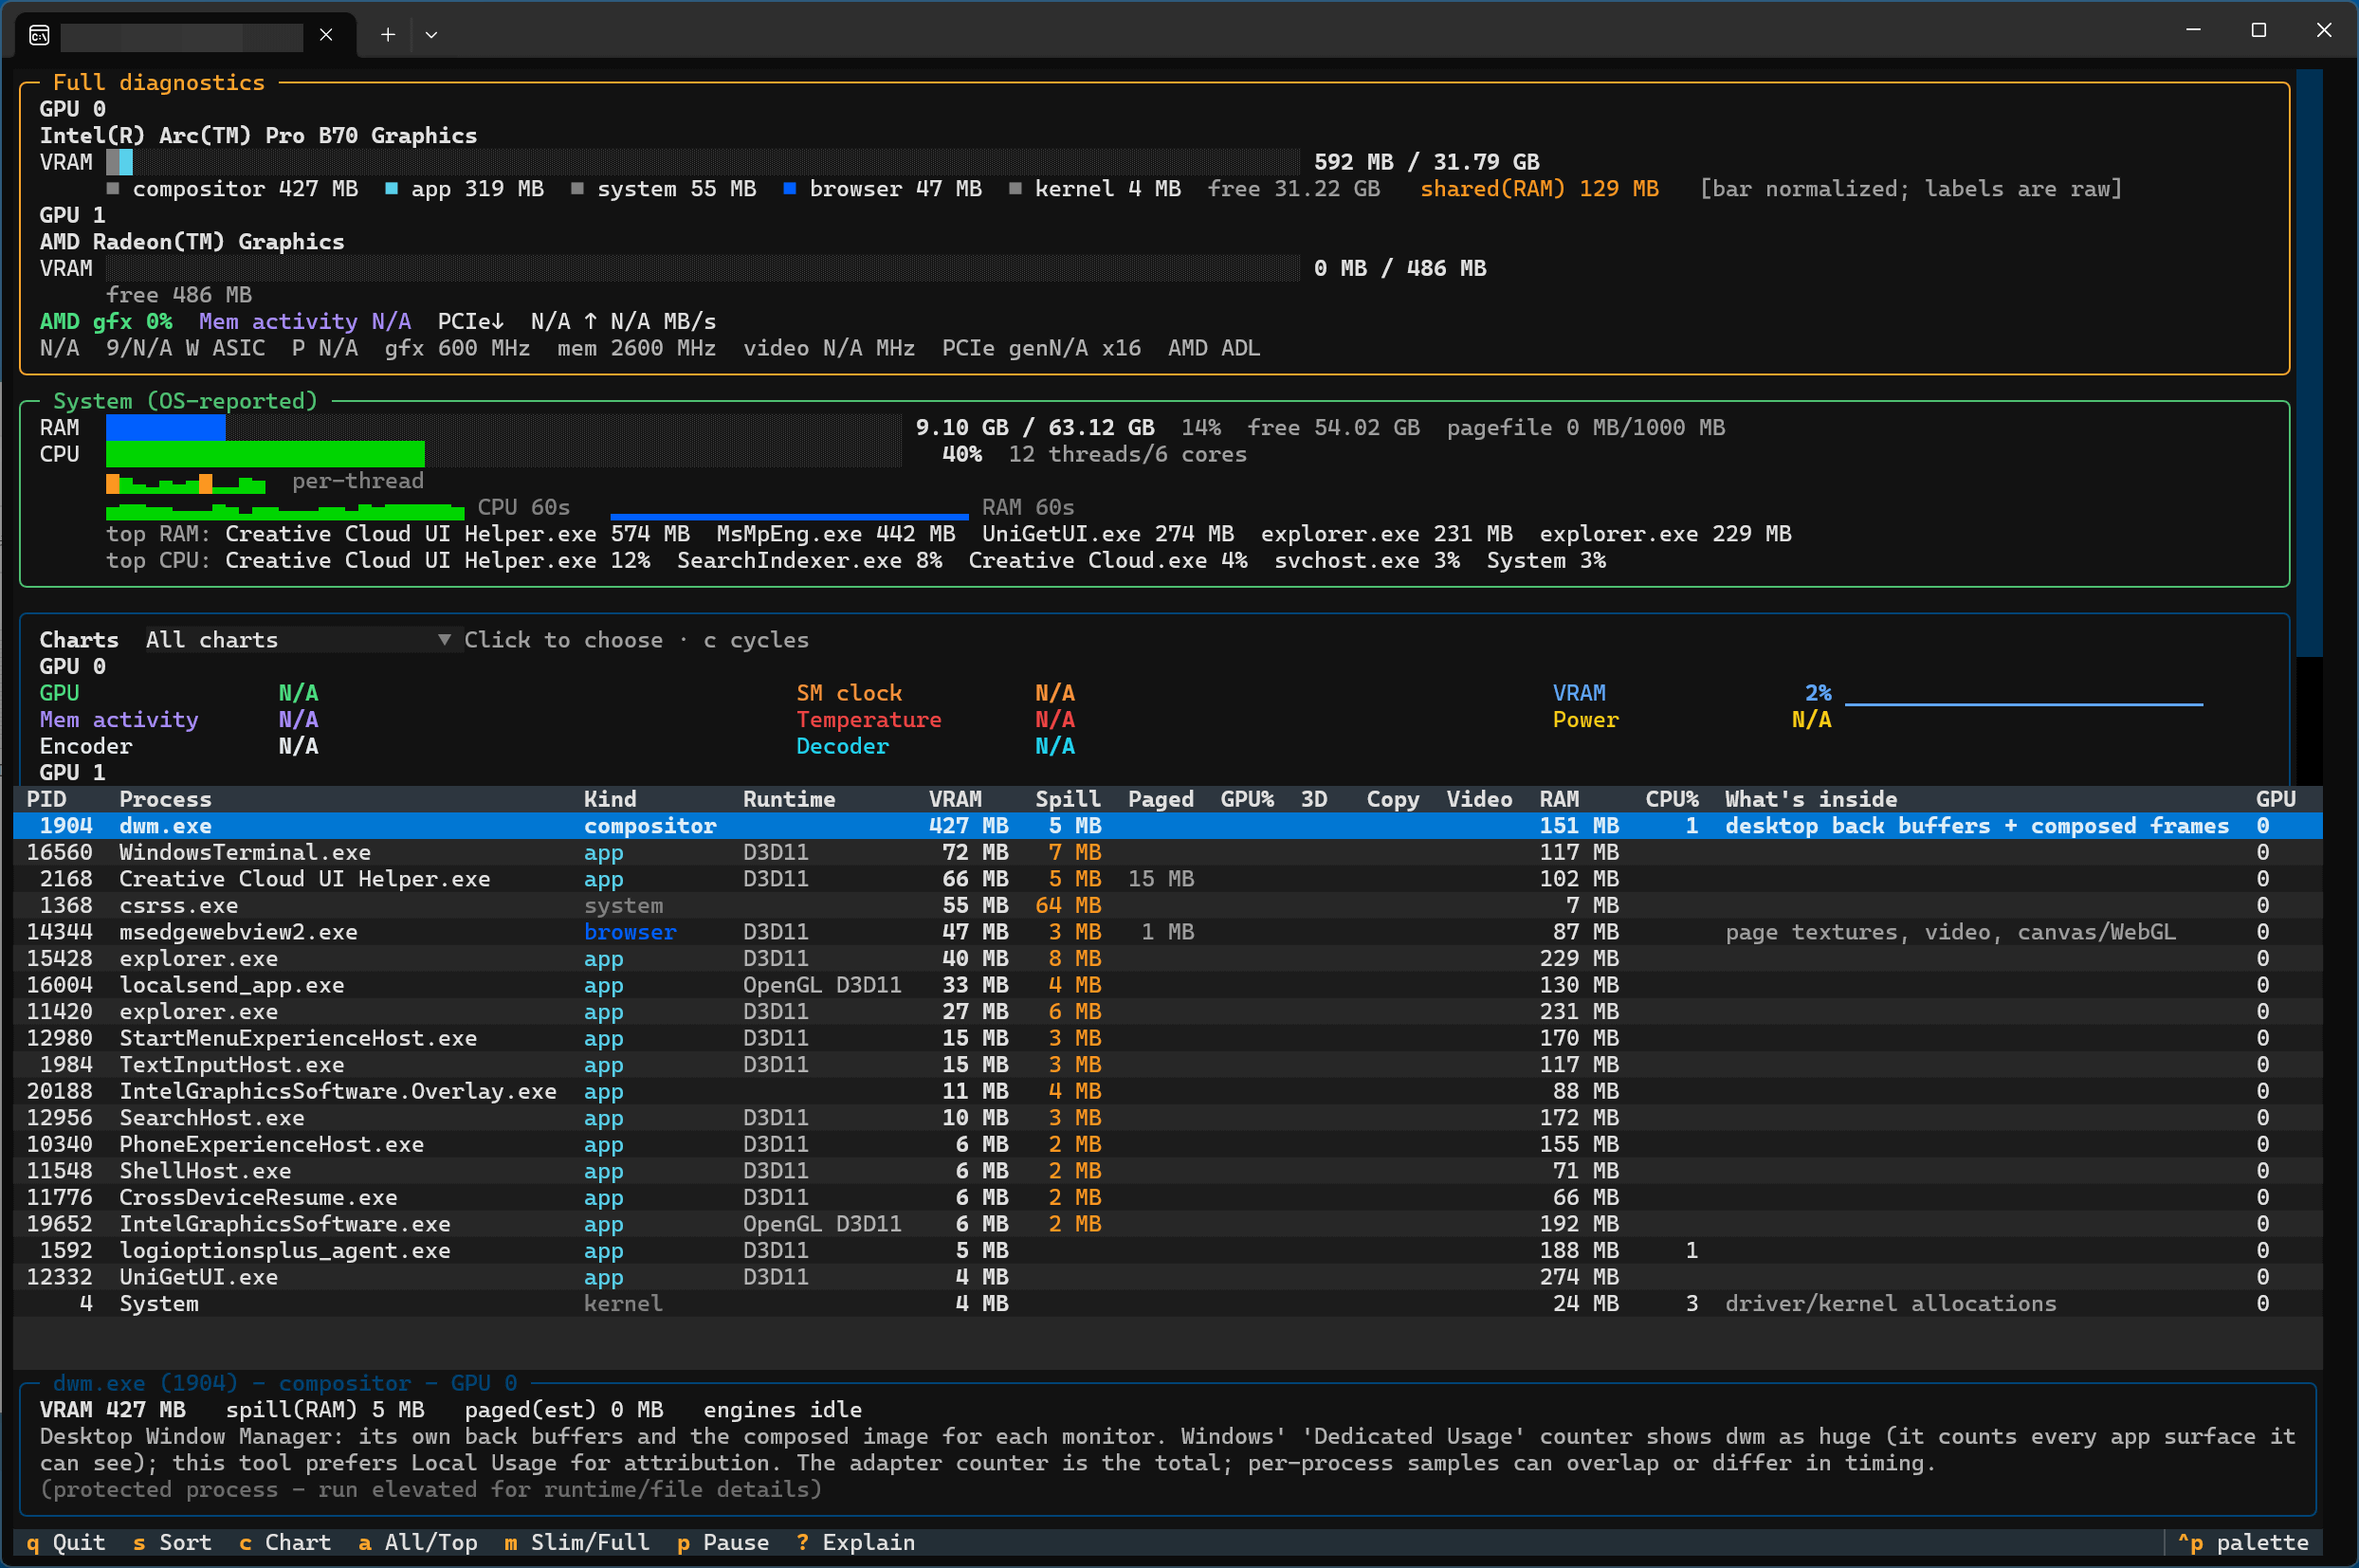
This launches gputaskman. From top to bottom, there are “an area that displays information about the GPU installed in the PC,” “an area that displays PC system information,” and “an area that displays detailed information for each task.” On the PC I ran this on, both Intel's “Intel Arc Pro B70” GPU and AMD's integrated “AMD Radeon Graphics” GPU were recognized.
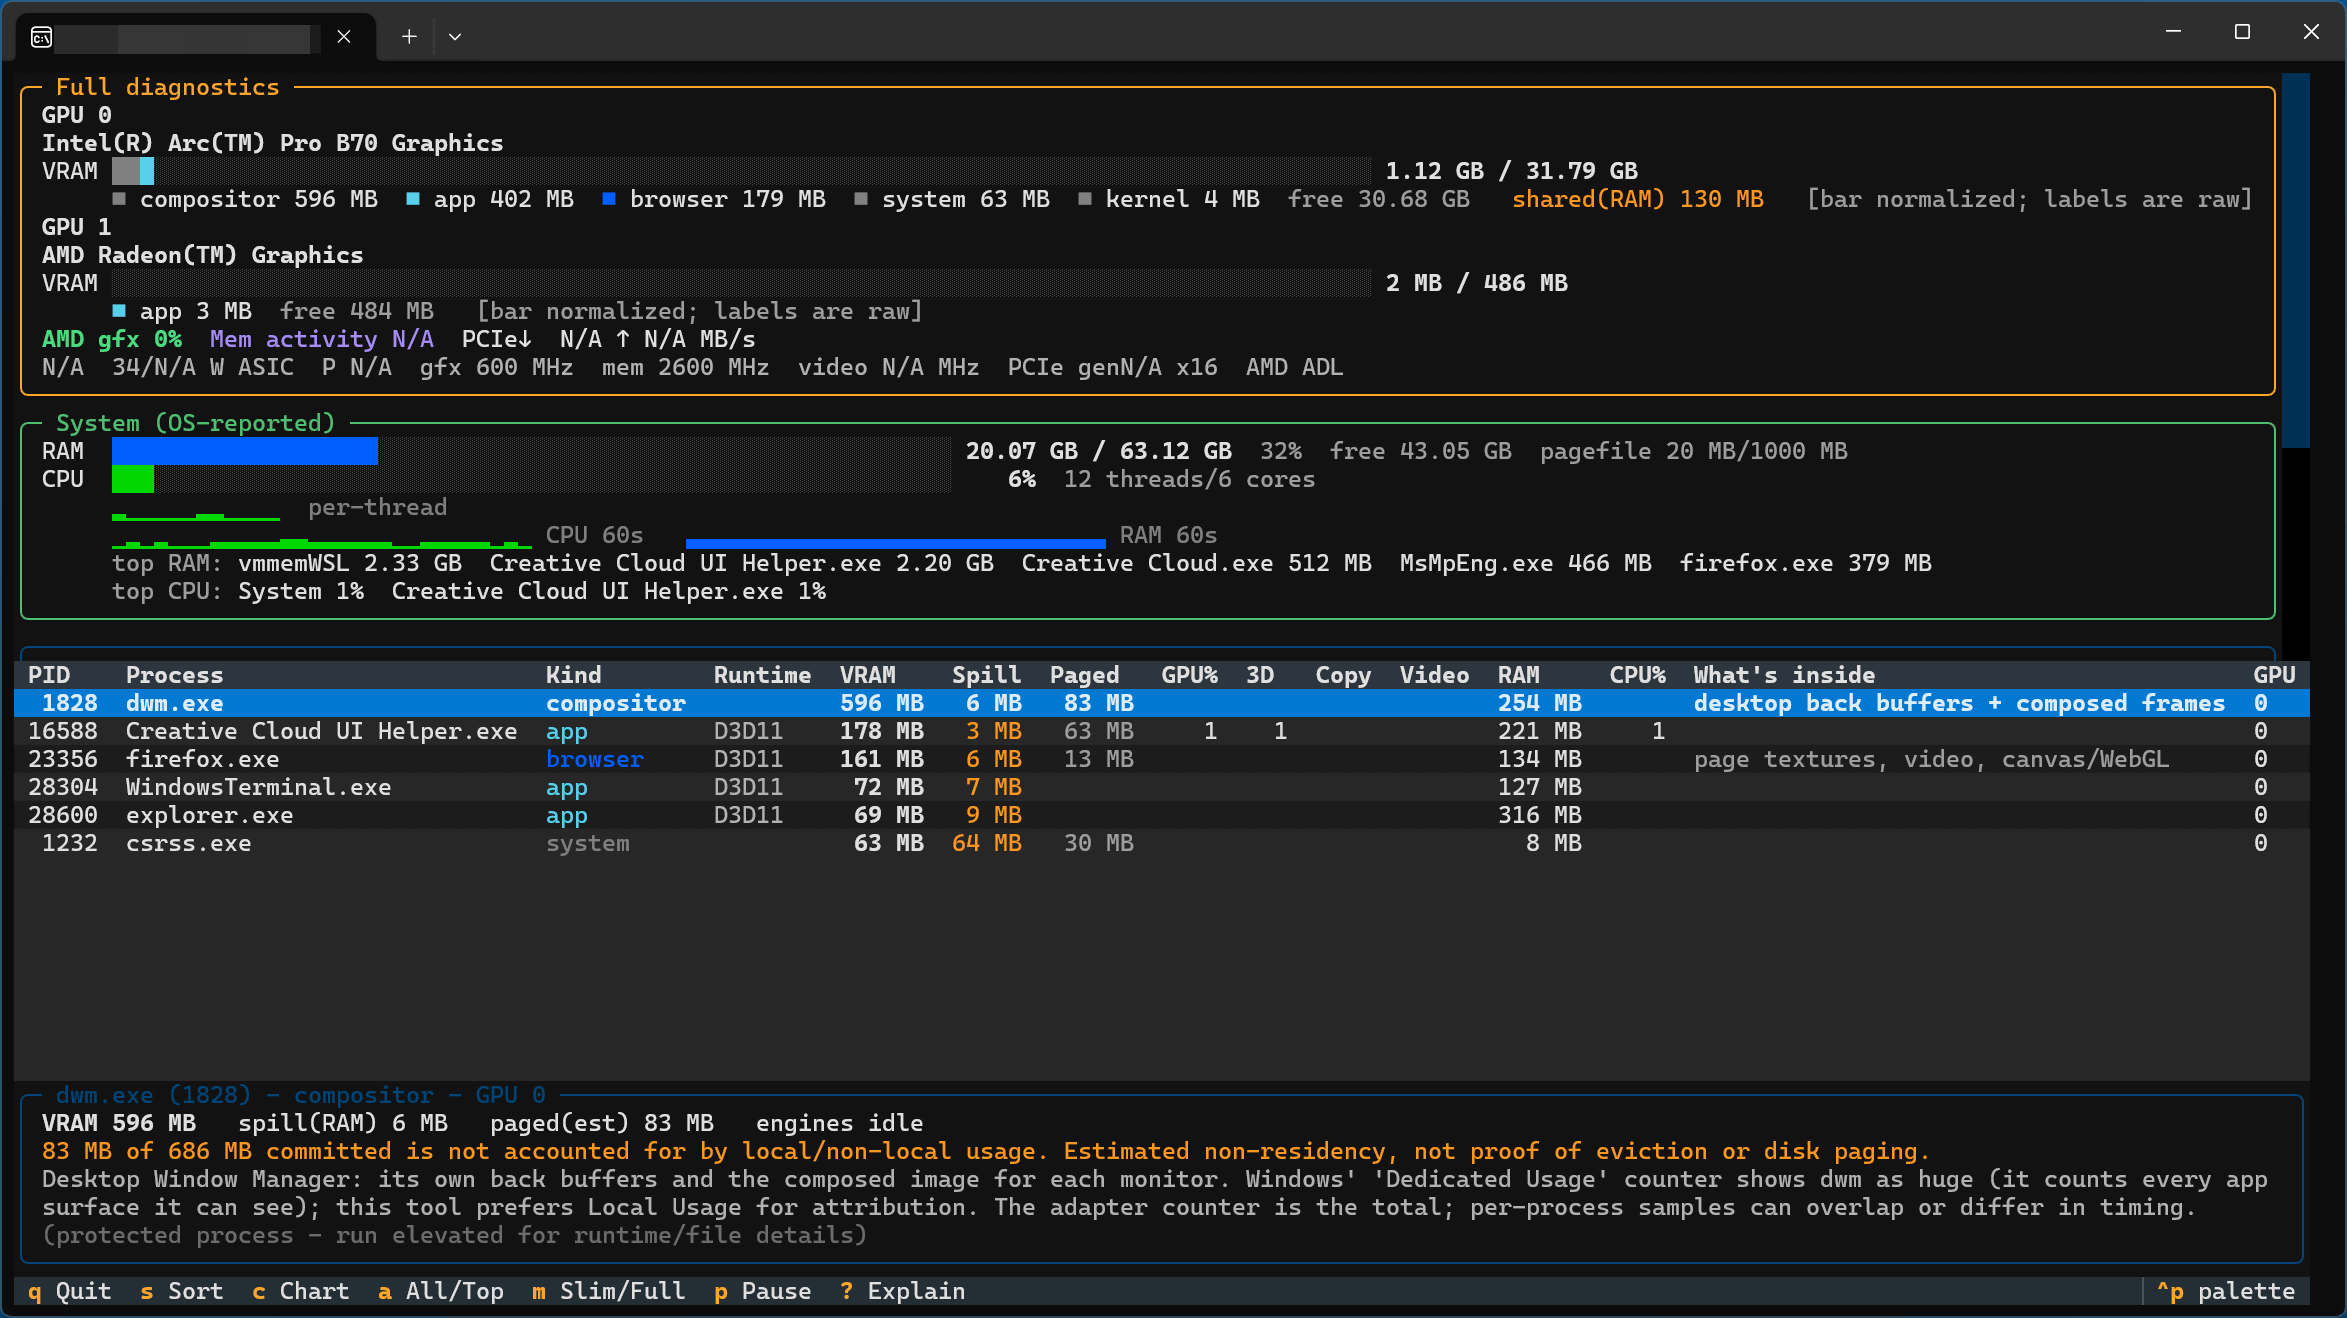
Initially, only the tasks at the top of the sort order are displayed. Pressing “a” on the keyboard displays all tasks.
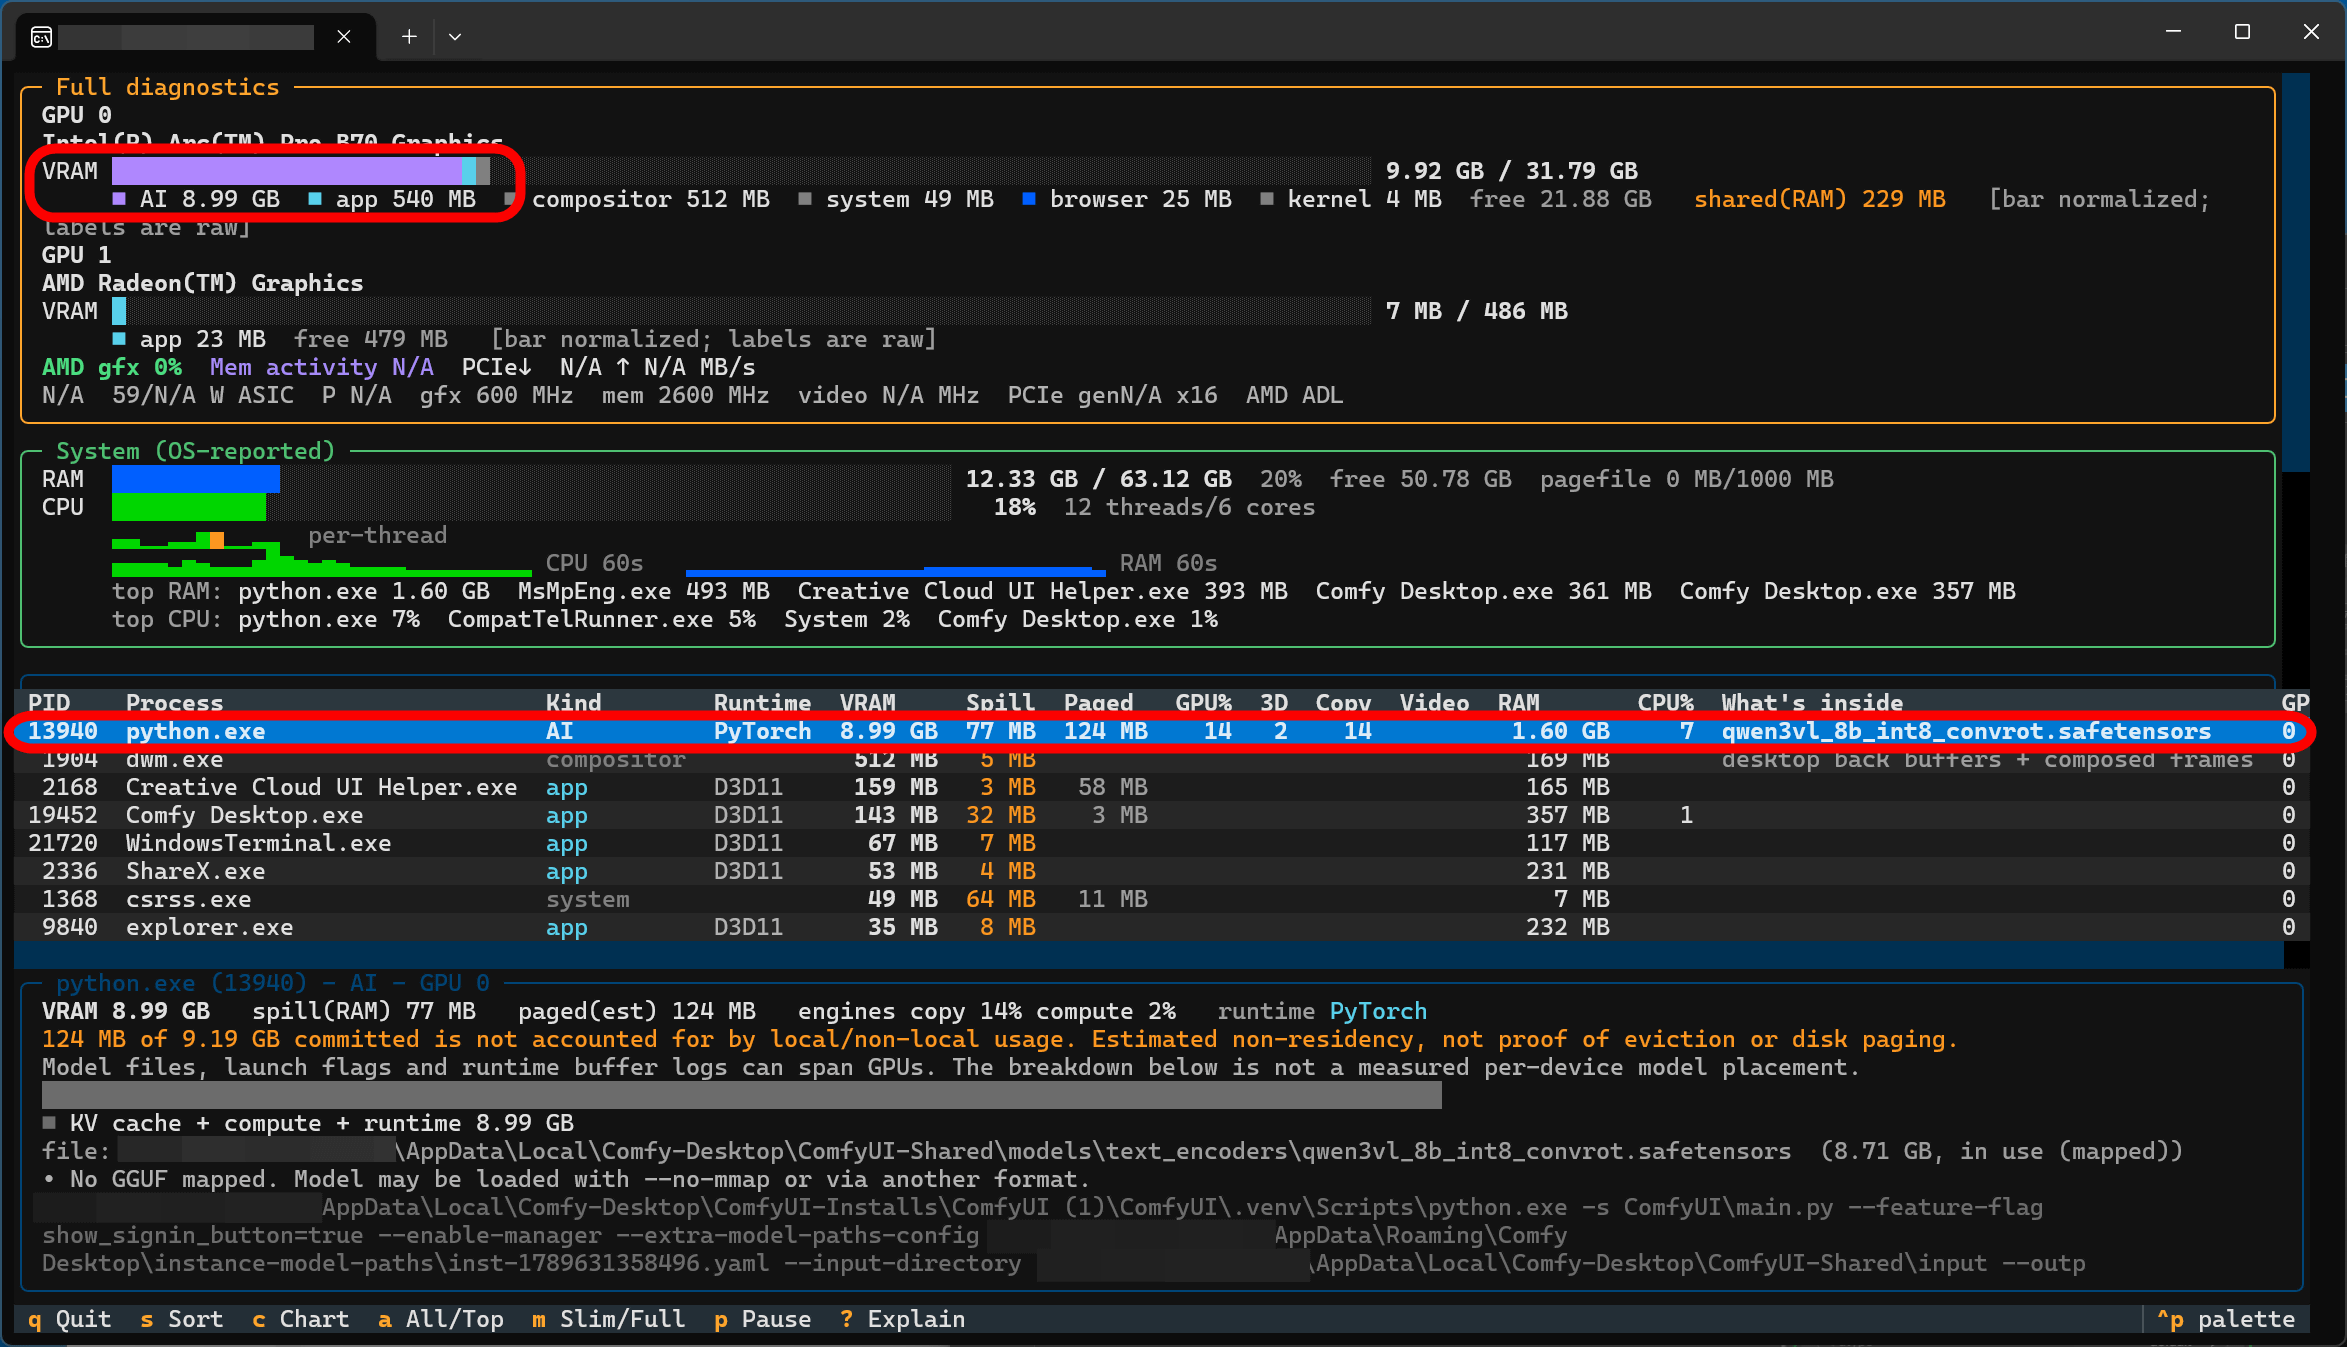
As a result of running image generation in ComfyUI and putting load on the GPU, the bar at the top indicating “VRAM usage for the Intel Arc Pro B70” increased. Furthermore, tasks such as “python.exe” that are placing load on the GPU are displayed at the bottom of the screen, and when the focus is moved to each task using the up and down keys, detailed information is displayed at the very bottom of the screen. In the following screenshot, it can be seen that “python.exe” is using 8.99 GB of VRAM and 1.60 GB of VRAM, that GPU utilization is 14%, that the runtime is PyTorch, and that the model running is “qwen3vl_8b_int8_convrot.safetensors,” among other things.
Additionally, Mr. Hanselman welcomes pull requests.
There's a lot going on in my GPU. I'm making a GPU Taskman to get insights to where my GPU memory is going. PRs welcome pic.twitter.com/6FwKqnFWDW
— Scott Hanselman 🌮 (@shanselman) November 3, 2026